Transforming education
IBM Watson for Education Classroom is a product designed for K-12 Educators, driven to transform the education experience. IBM Watson for Education is empowering teachers and administrators to provide a personalized experience for every student.
Role
UX/UI
Research
Strategy & Planning
Design Thinking Facilitator
Team
2 Product Designers
10 Engineers
2 Researchers
Background
Problem
Currently, K-12 educators and administrators struggle with getting a holistic view of their students and faculty. They are dealing with disparate data systems and can’t see everything in one place. They have no way to see the big picture as it ties into their high-level goals and pro-actively help at-risk students.
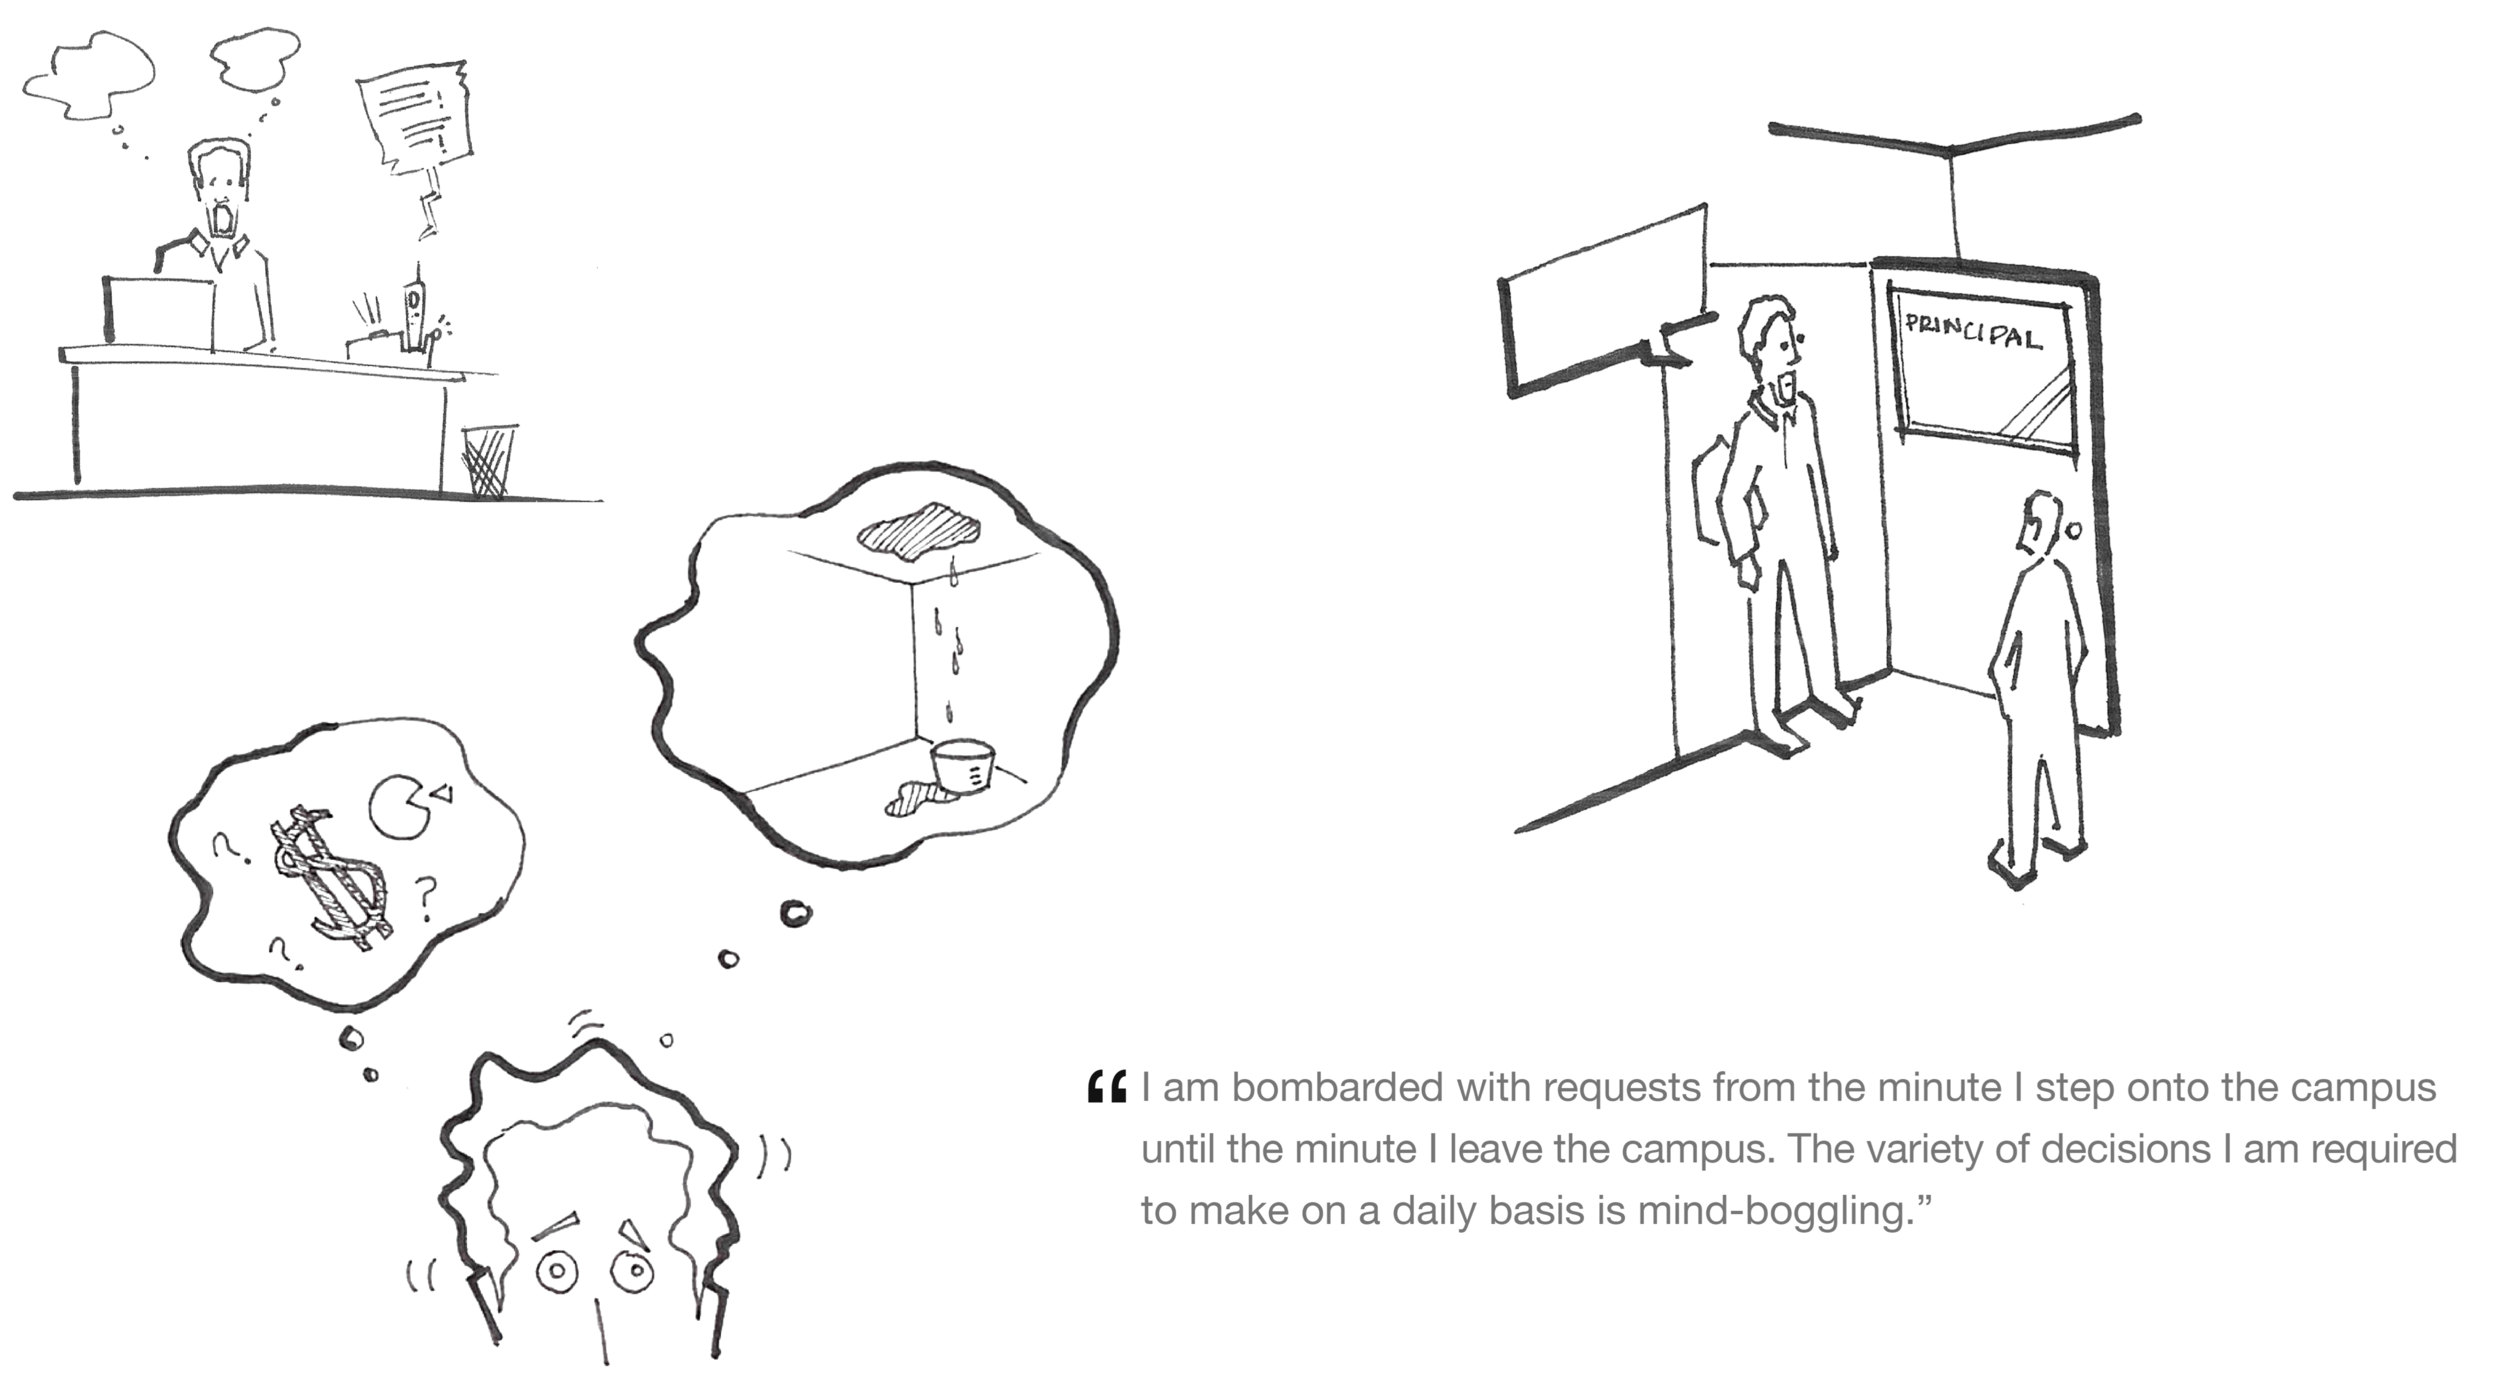
Also, school administrators such as Principals, Curriculum Coordinators, and Guidance Counselors have difficulty prioritizing their responsibilities, pulling them in many directions. They struggle to connect with each student and supporting their faculty.
Building Empathy
Persona and As-Is Development
The first release of IBM Watson for Education Classroom concentrated on a middle school teacher as its primary user. For the second release, we shifted our focus to administrative roles. We researched school Principals, Guidance Counselors, and Curriculum Coordinators.
From our secondary research, we created personas, as-is scenarios, and day-in-the-life stories for each role. Ultimately, we chose the Principal to be our next user.
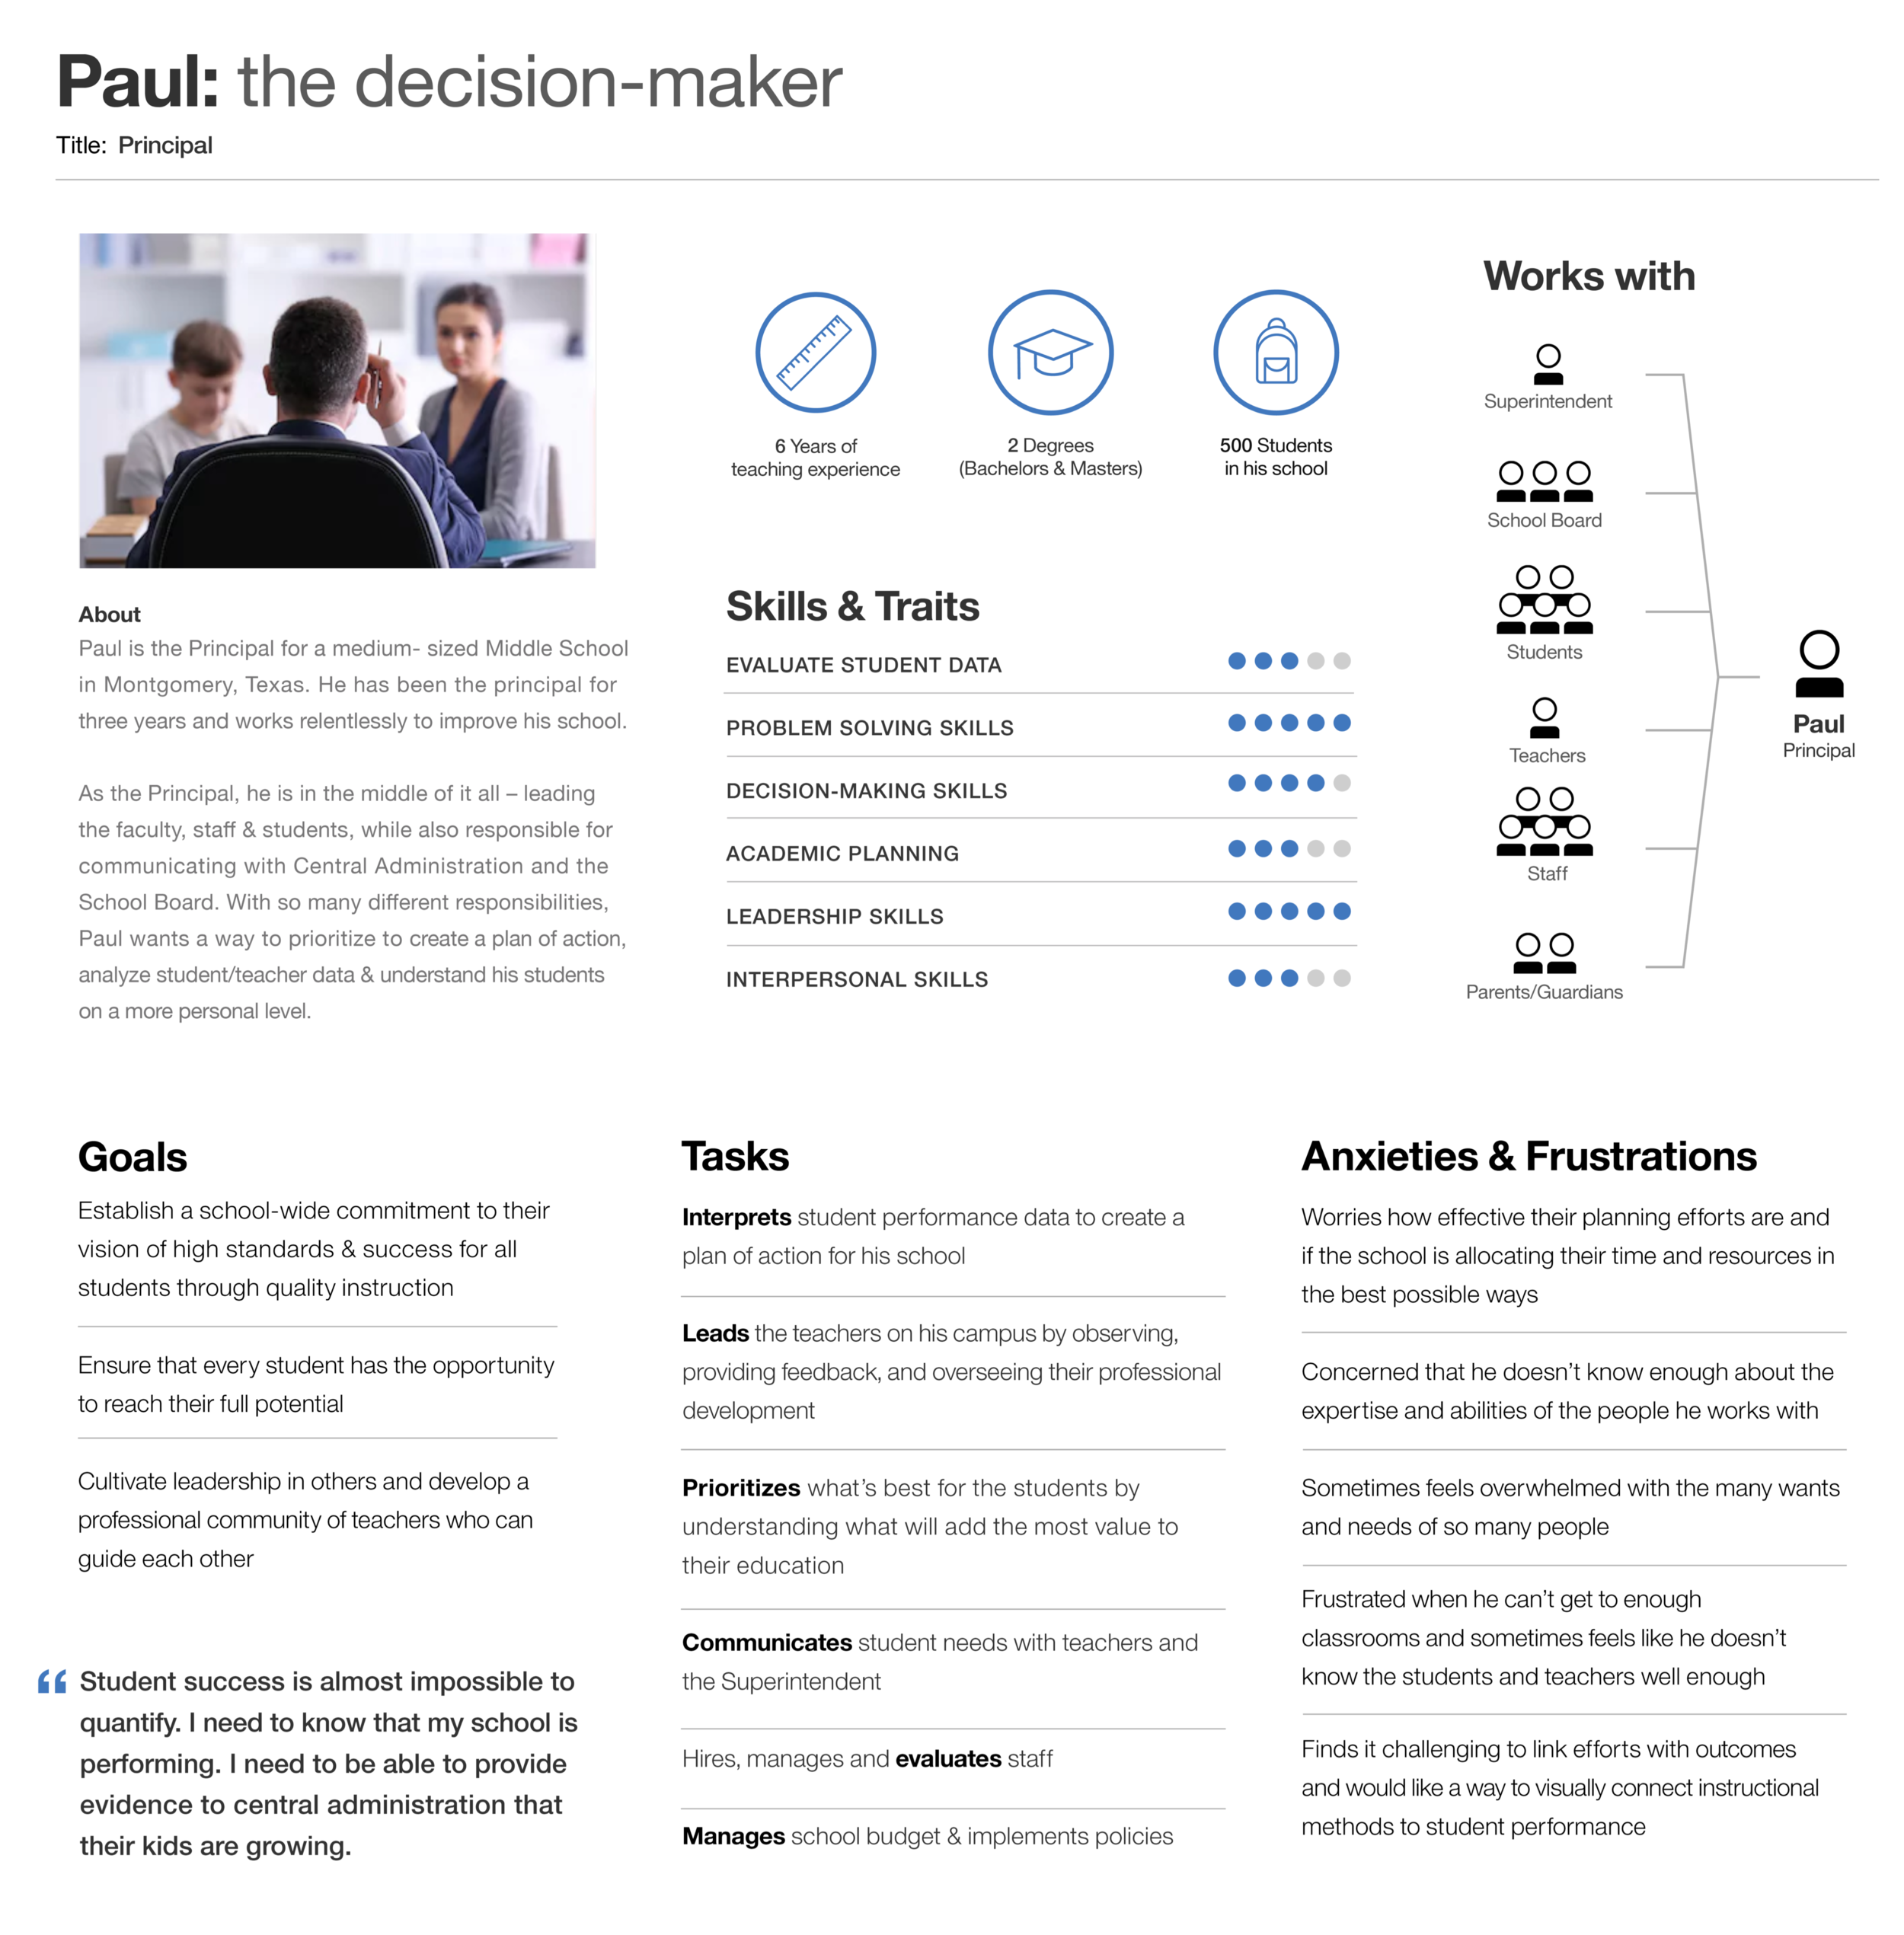
Meet Paul.
Design Thinking Workshop
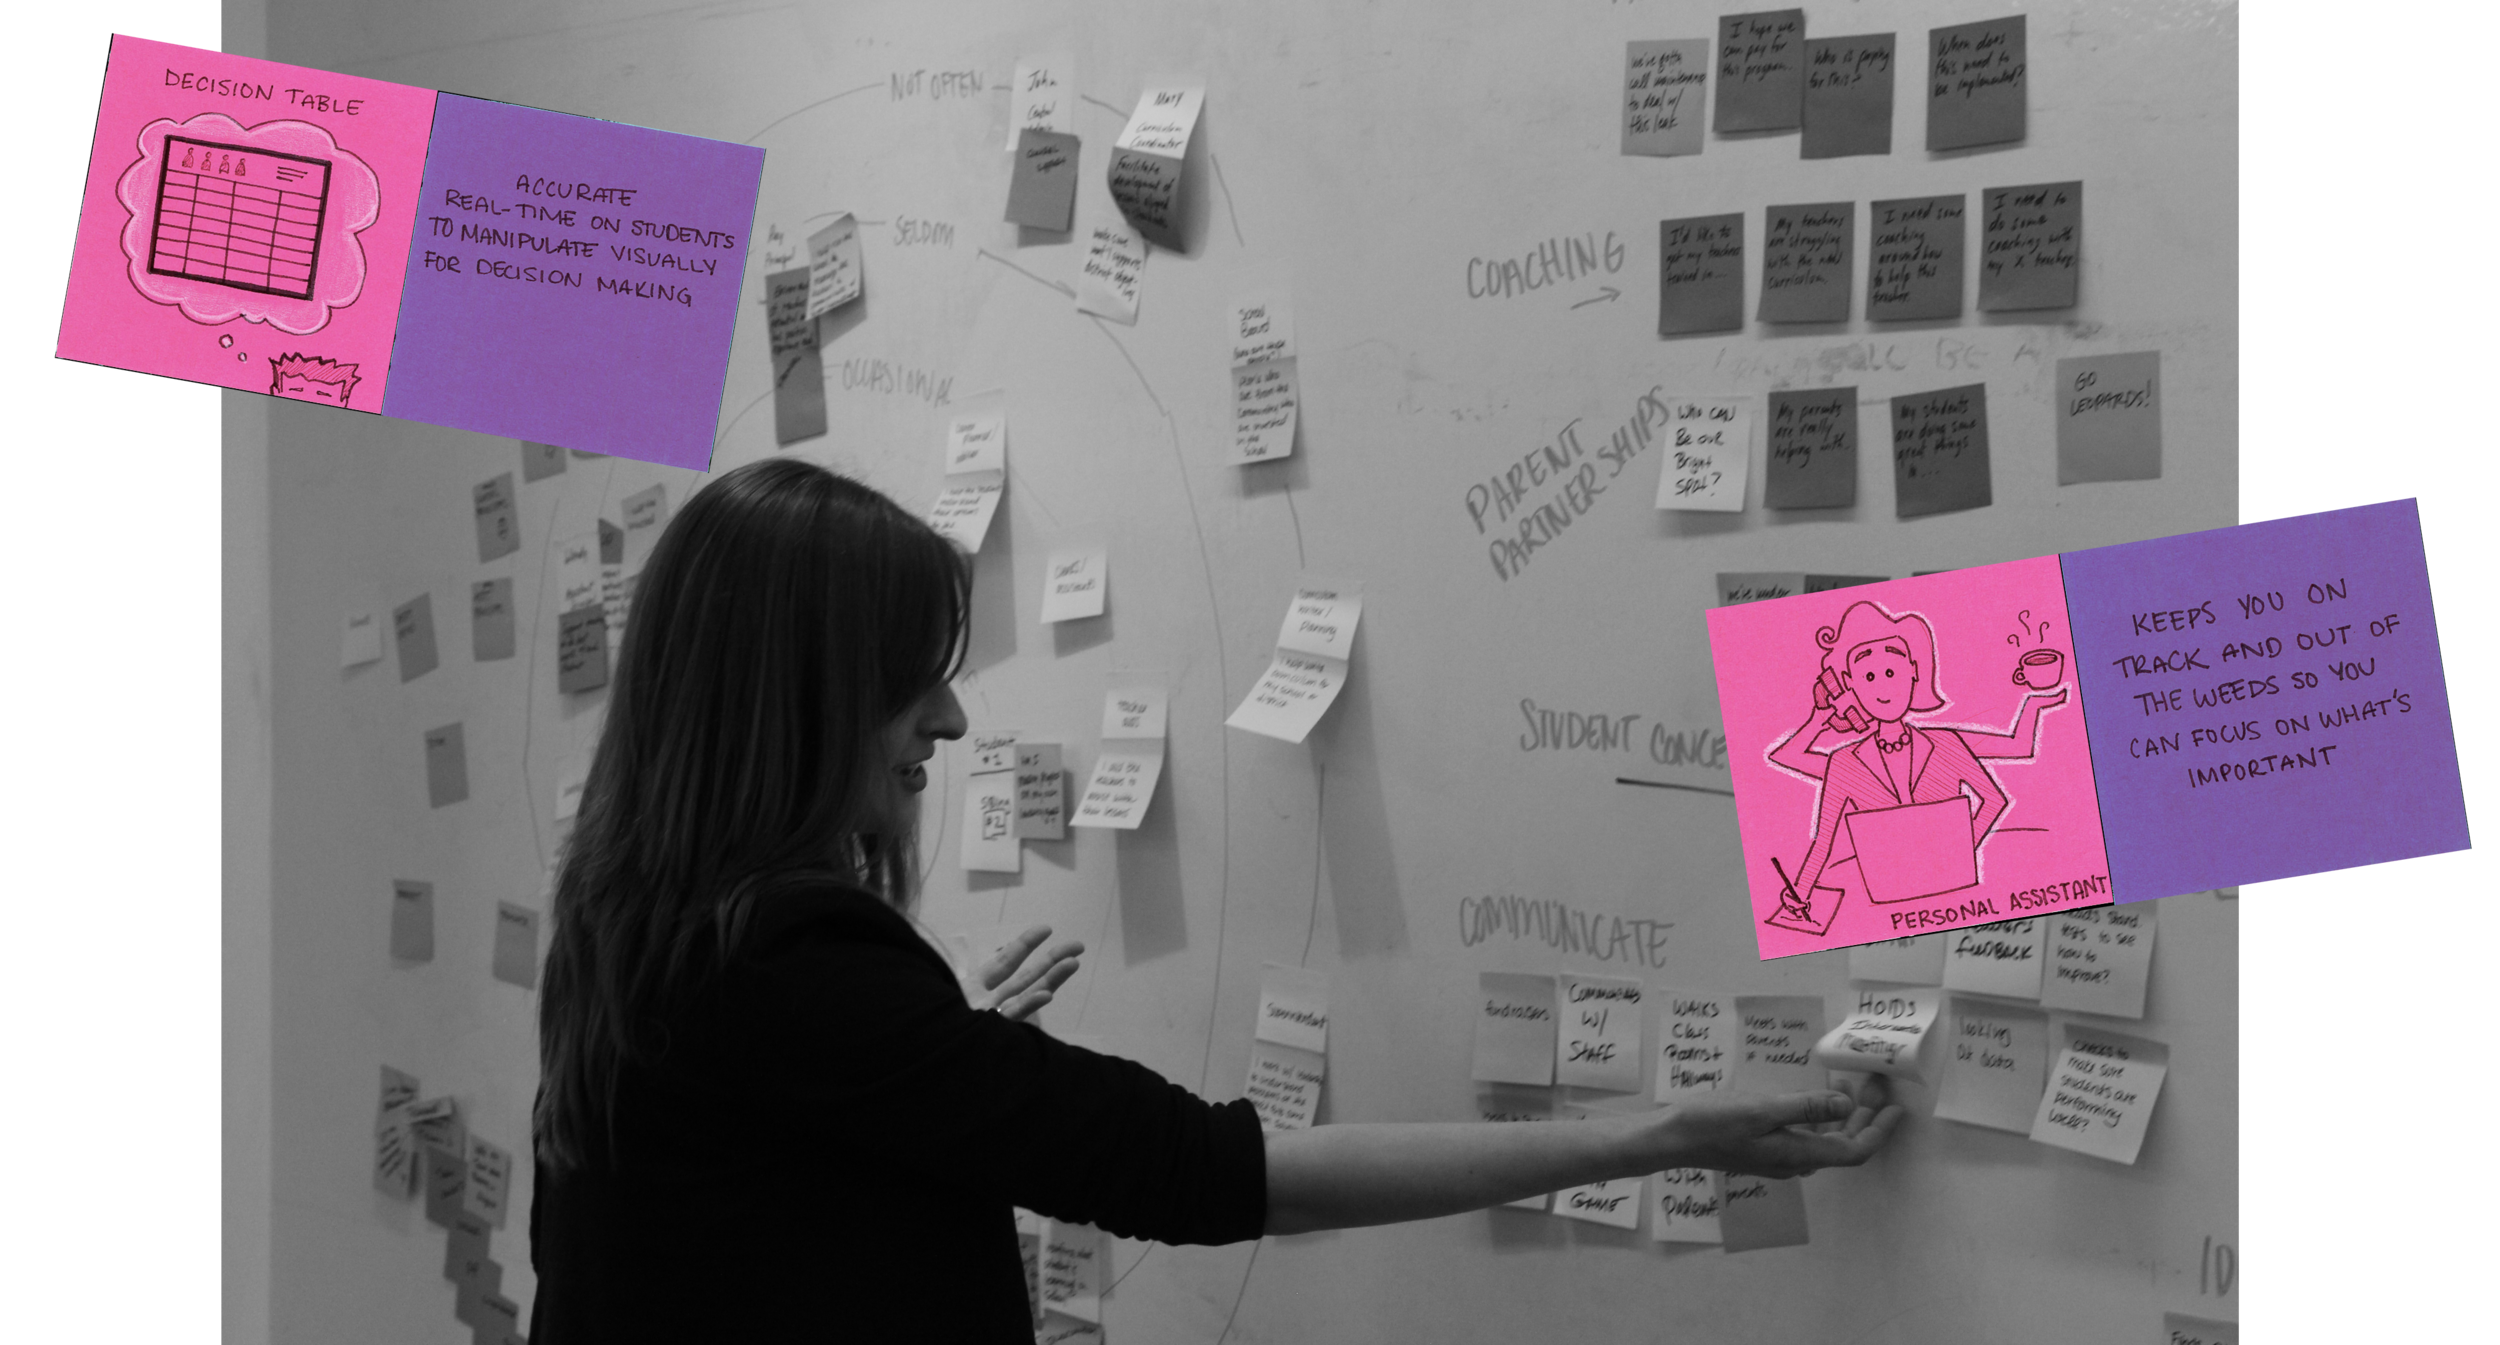
We went on-site to the Watson Research Lab with our personas and as-is scenarios to dig even further into the Administrator role. We validated our assumptions and gained additional insight.
Key Findings
Prioritization, time and resource allocation
Educators gravitate to the most immediate problem. This is counterproductive as it leads to the more pressing issues put on the back burner. They have a lack of clarity on what makes the most difference and what’s necessary; in other words, they have no idea what gives them the most bang for their buck.
Disjointed data points
Valuable data is being stored in many different places and systems, making it difficult to make meaningful connections and almost impossible to measure results. This is important because schools receive their funding as a direct result of the percentage of the total student population that attends class each day.
Efficiency
Educators are always subject to the pressure of time constraints and financial implications. Through further discussion, we converged on the idea that this is attributed to not only time constraints but also issues with efficiency.
Decision making
Administrators have no way to expose the logic behind their decisions to stakeholders; for example, their budget needs and resource allocation.
Needs
Support
Students, parents, and teachers need a way to understand learning strengths, progress, and pathways better so that they can efficiently take action.
Educators want something that keeps them on track and helps them prioritize so they can focus on what’s important.
Inclusive and integrated
Educators need a way to connect all of their data and resources. They need a single place that allows them to spend less time in the weeds, and more time to supporting their students and teachers.
Meaningful insights from data
Students, parents, and teachers need a way to quickly gain insight from data so that they can take action.
Prioritization
Students and teachers need a way to analyze efforts and outcomes to be able to focus on what is most beneficial and essential to them right now.
Decision making
Educators want all of their data and resources in one place to save time and have the ability to draw meaningful insight from data aggregation.

Wireframes and exploration
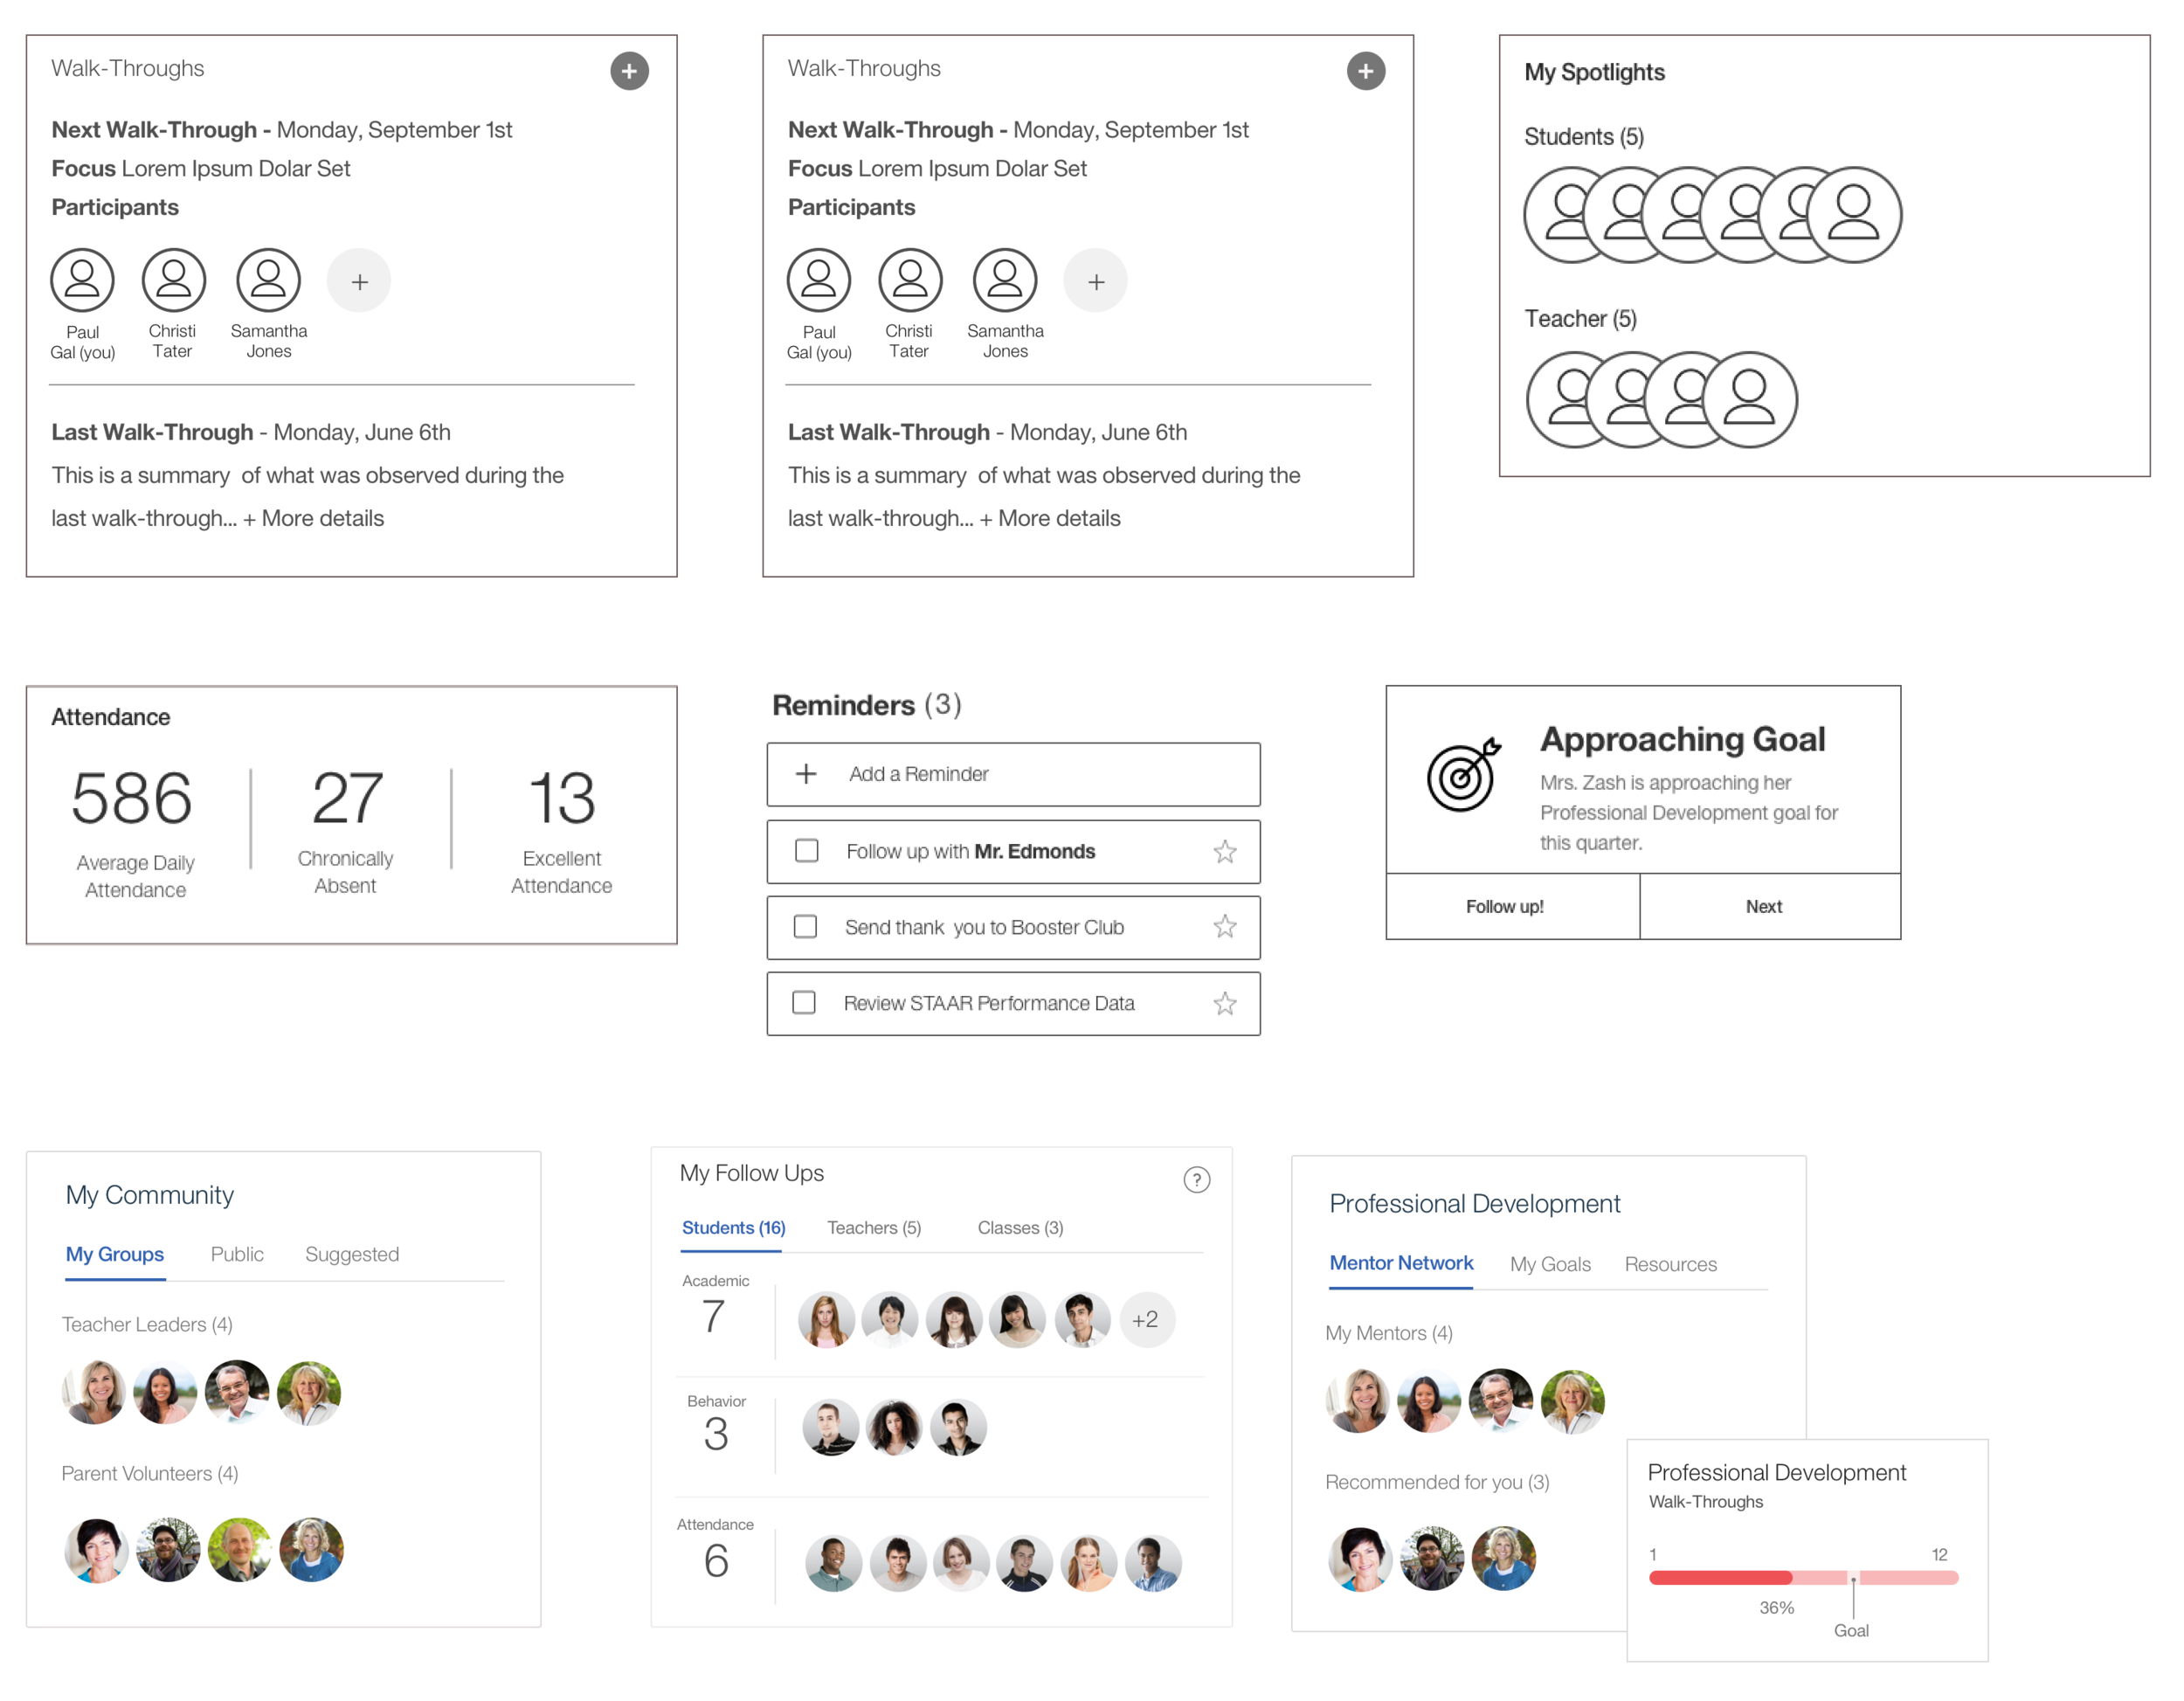
With low-fidelity paper prototypes, I tested the planned the workflow with Administrators. I focused on the overall workflow of the product and dug deeper into the components of the Administrator dashboard. It was vital to understand how the users wanted information displayed to maximize actionability. From here, I made adjustments before moving forward with high-fidelity mocks and InVision prototypes.

“We have all of the resources we just need a way to connect the dots.”
Connecting the dots
Administrator overview
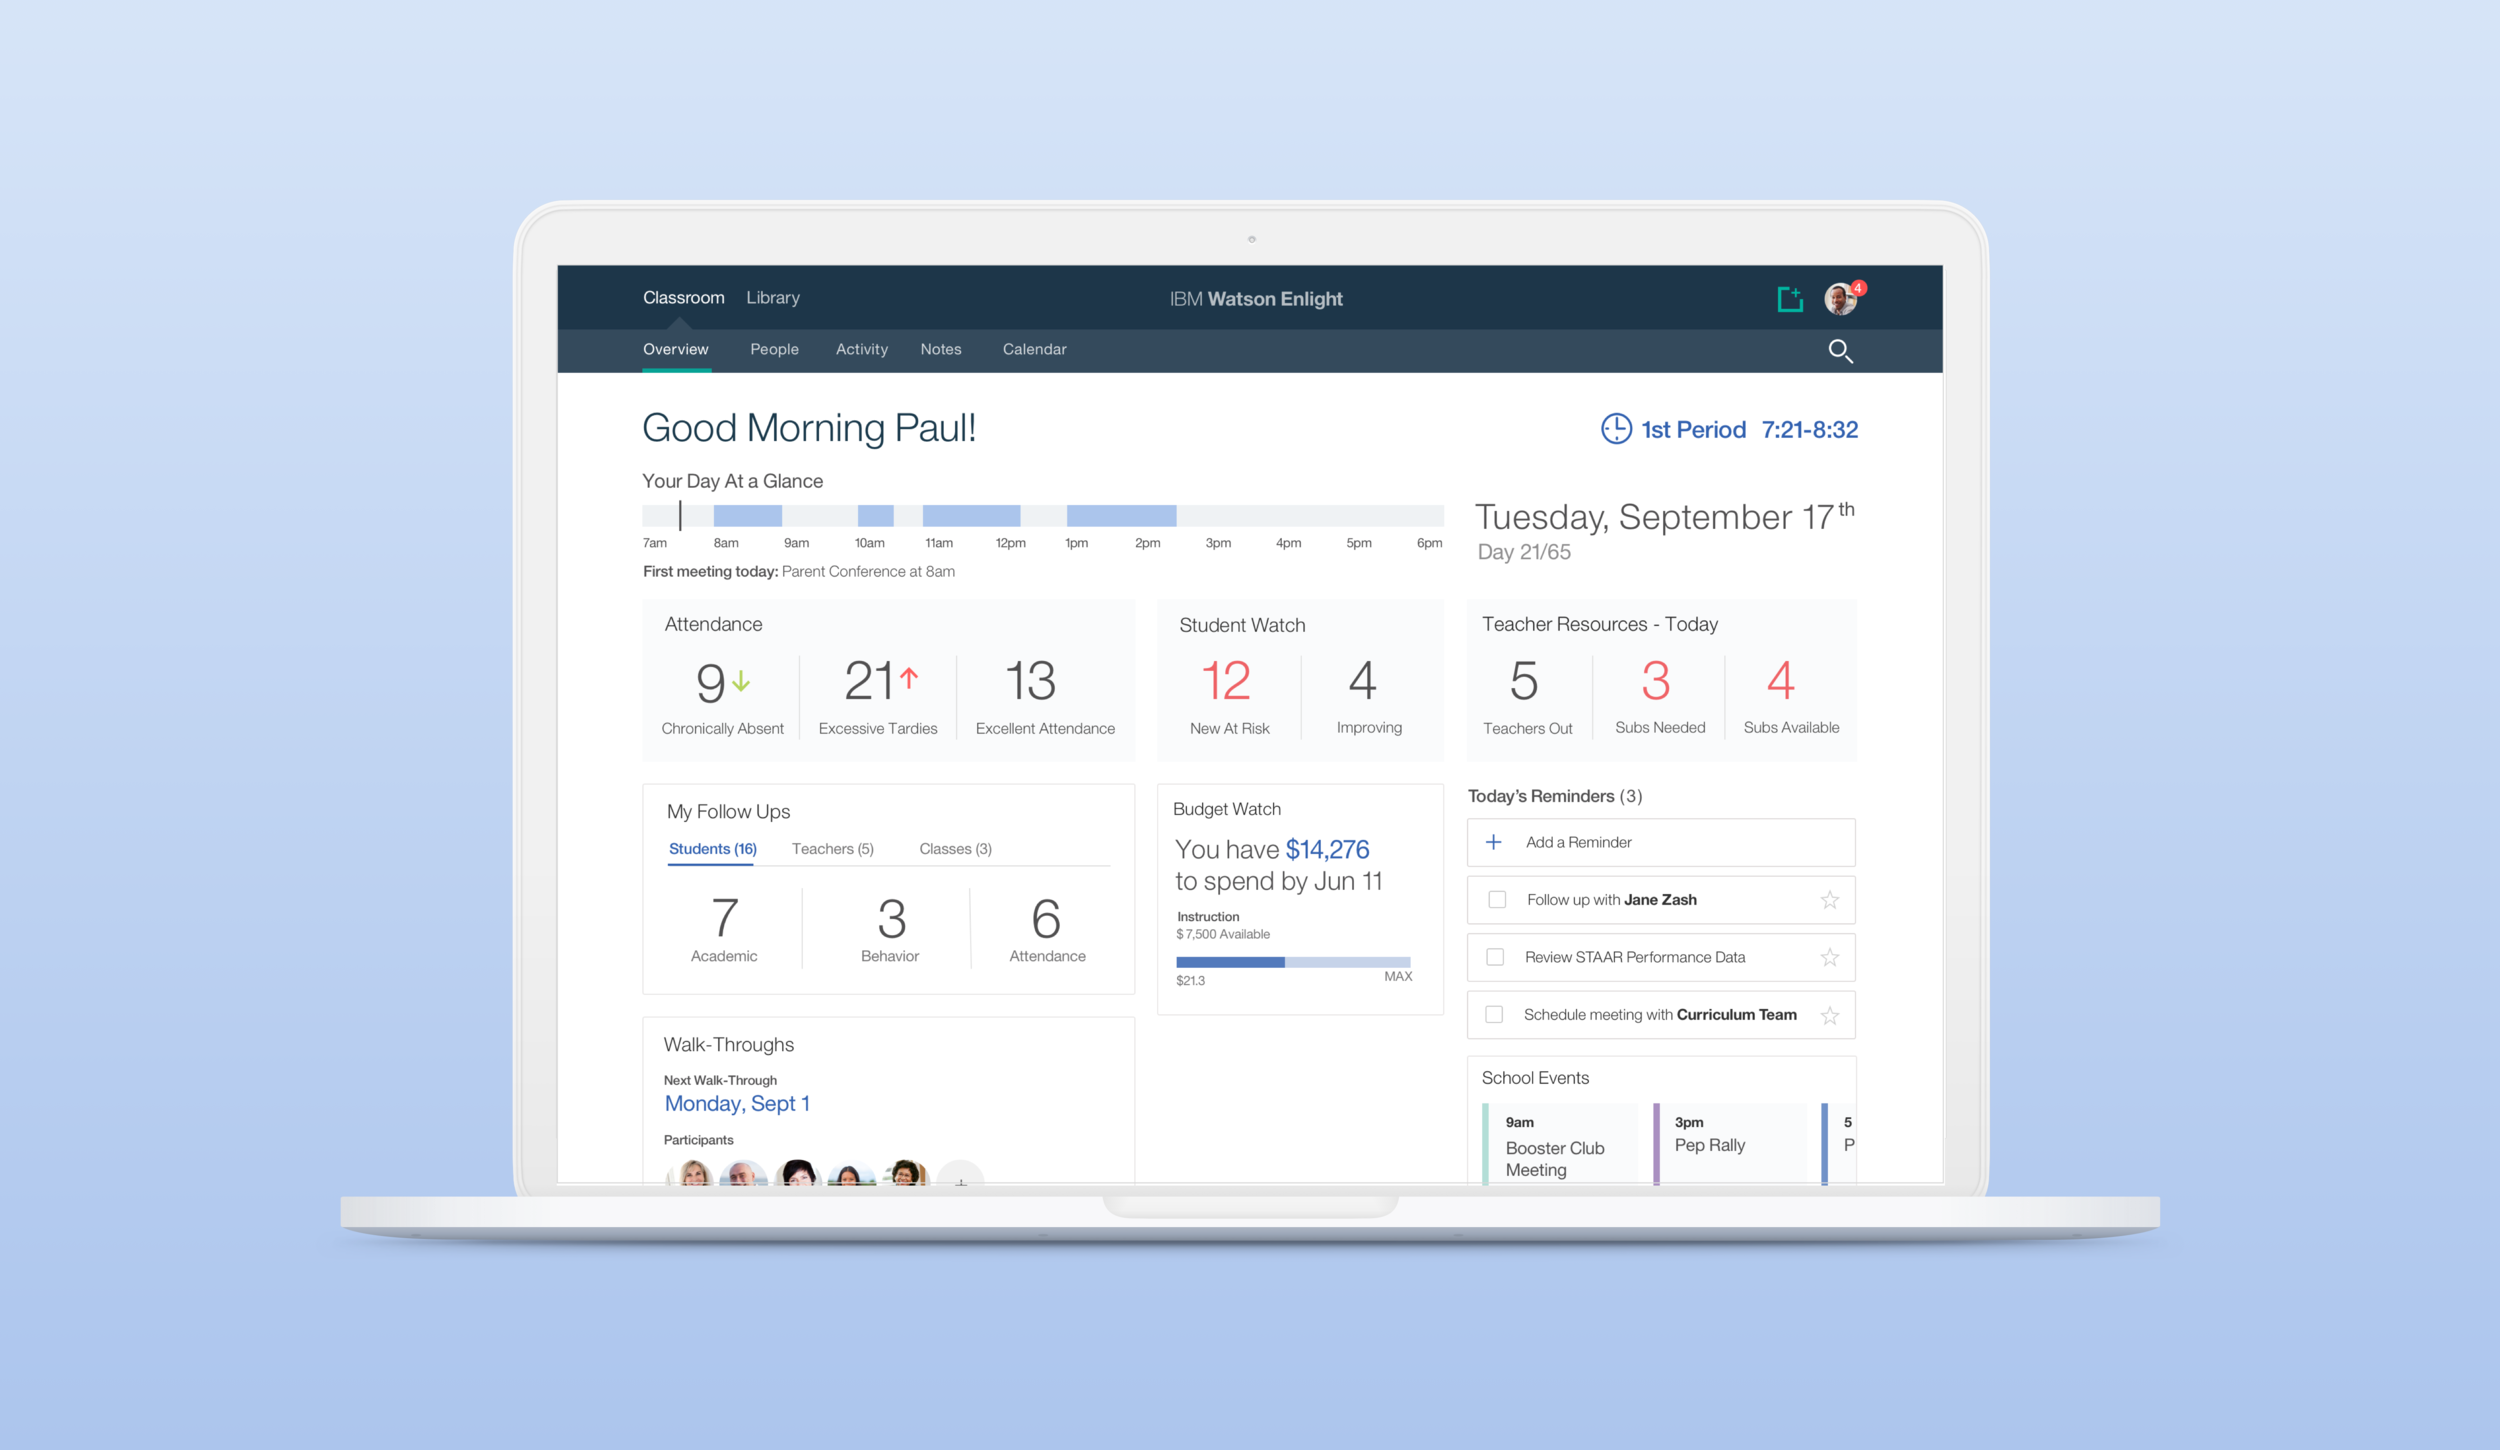
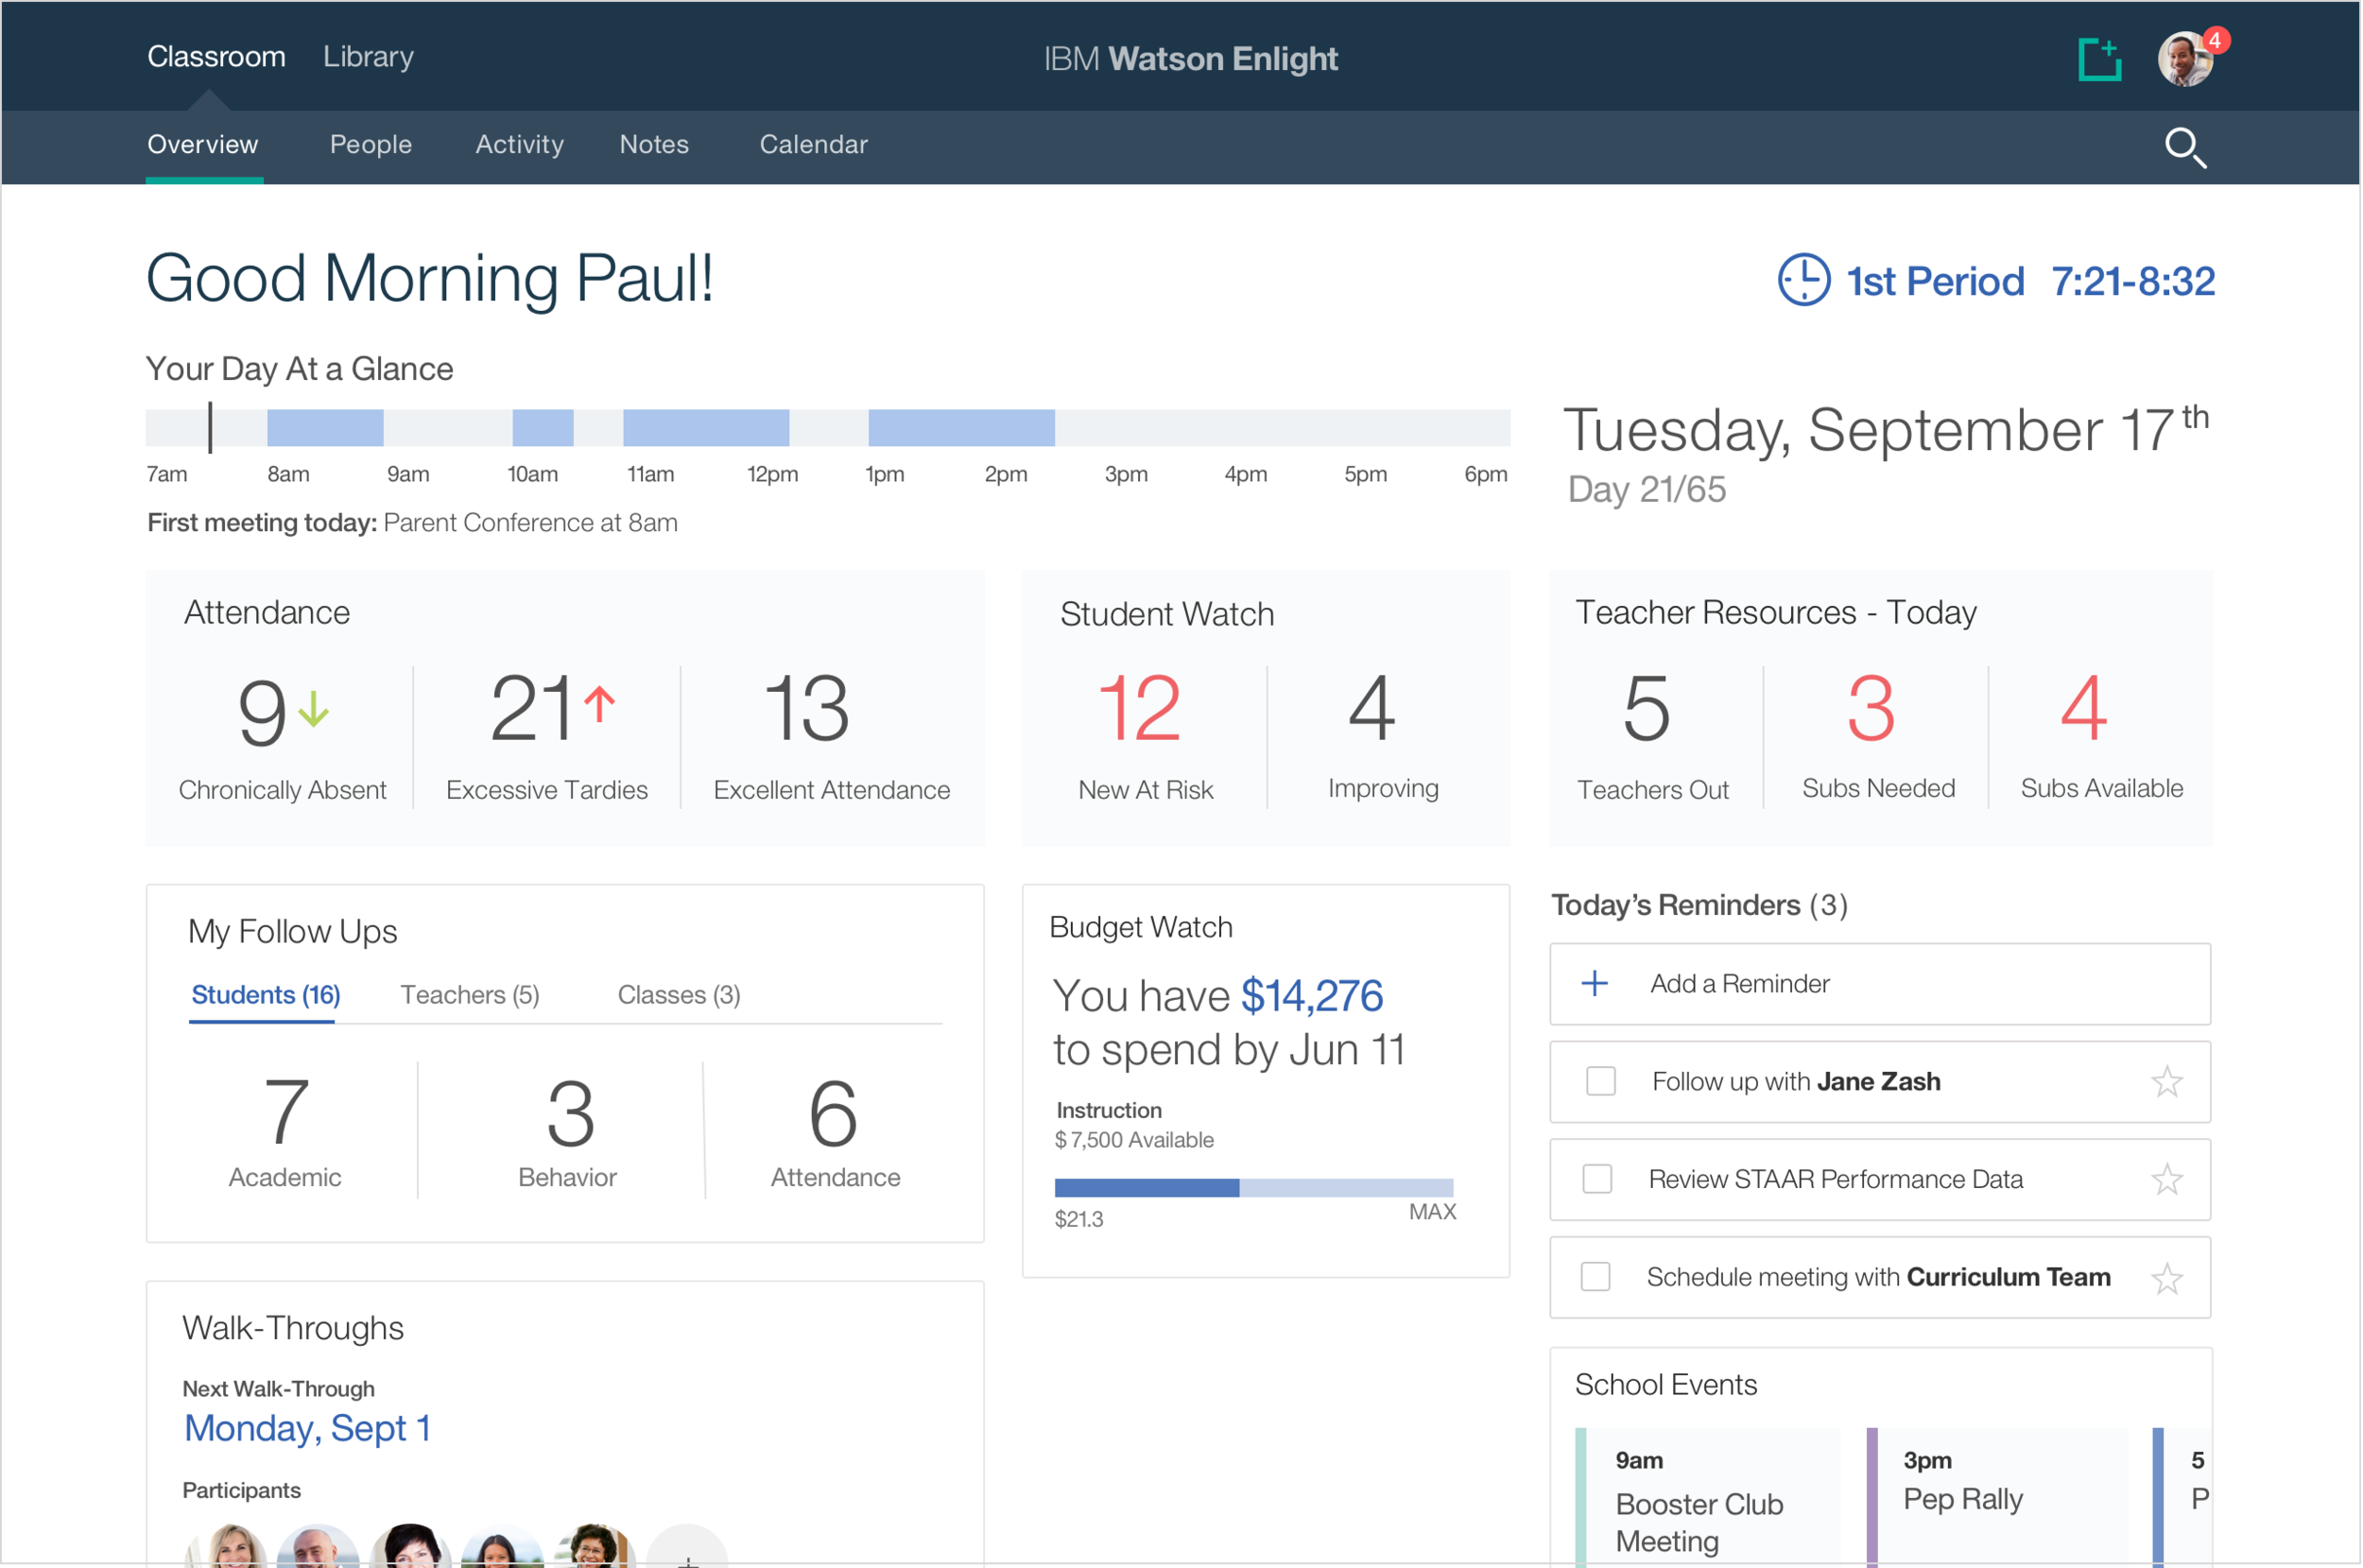
Administrators open up IBM Watson for Education for Classroom and can immediately see a snapshot of their day. Including upcoming meetings, school events, notifications and follow ups for both students and teachers.
A bird’s eye view
We created a solution that supports educators and administrators by providing a 360˚ view of students and faculty to better understand learning strengths, progress and pathways, peer mentorship, and improved communication so that they can efficiently take action.
Inclusive and integrated
The solution is inclusive and integrated; it takes into consideration the high-level goals that educators need to be aware of. Educators can go to one place that connects all of their data and resources, allowing them to spend less time in the weeds, more time supporting their teachers and students, and gives them the ability to draw meaningful insight from data aggregation.
Keeping on top of things
Activity feed
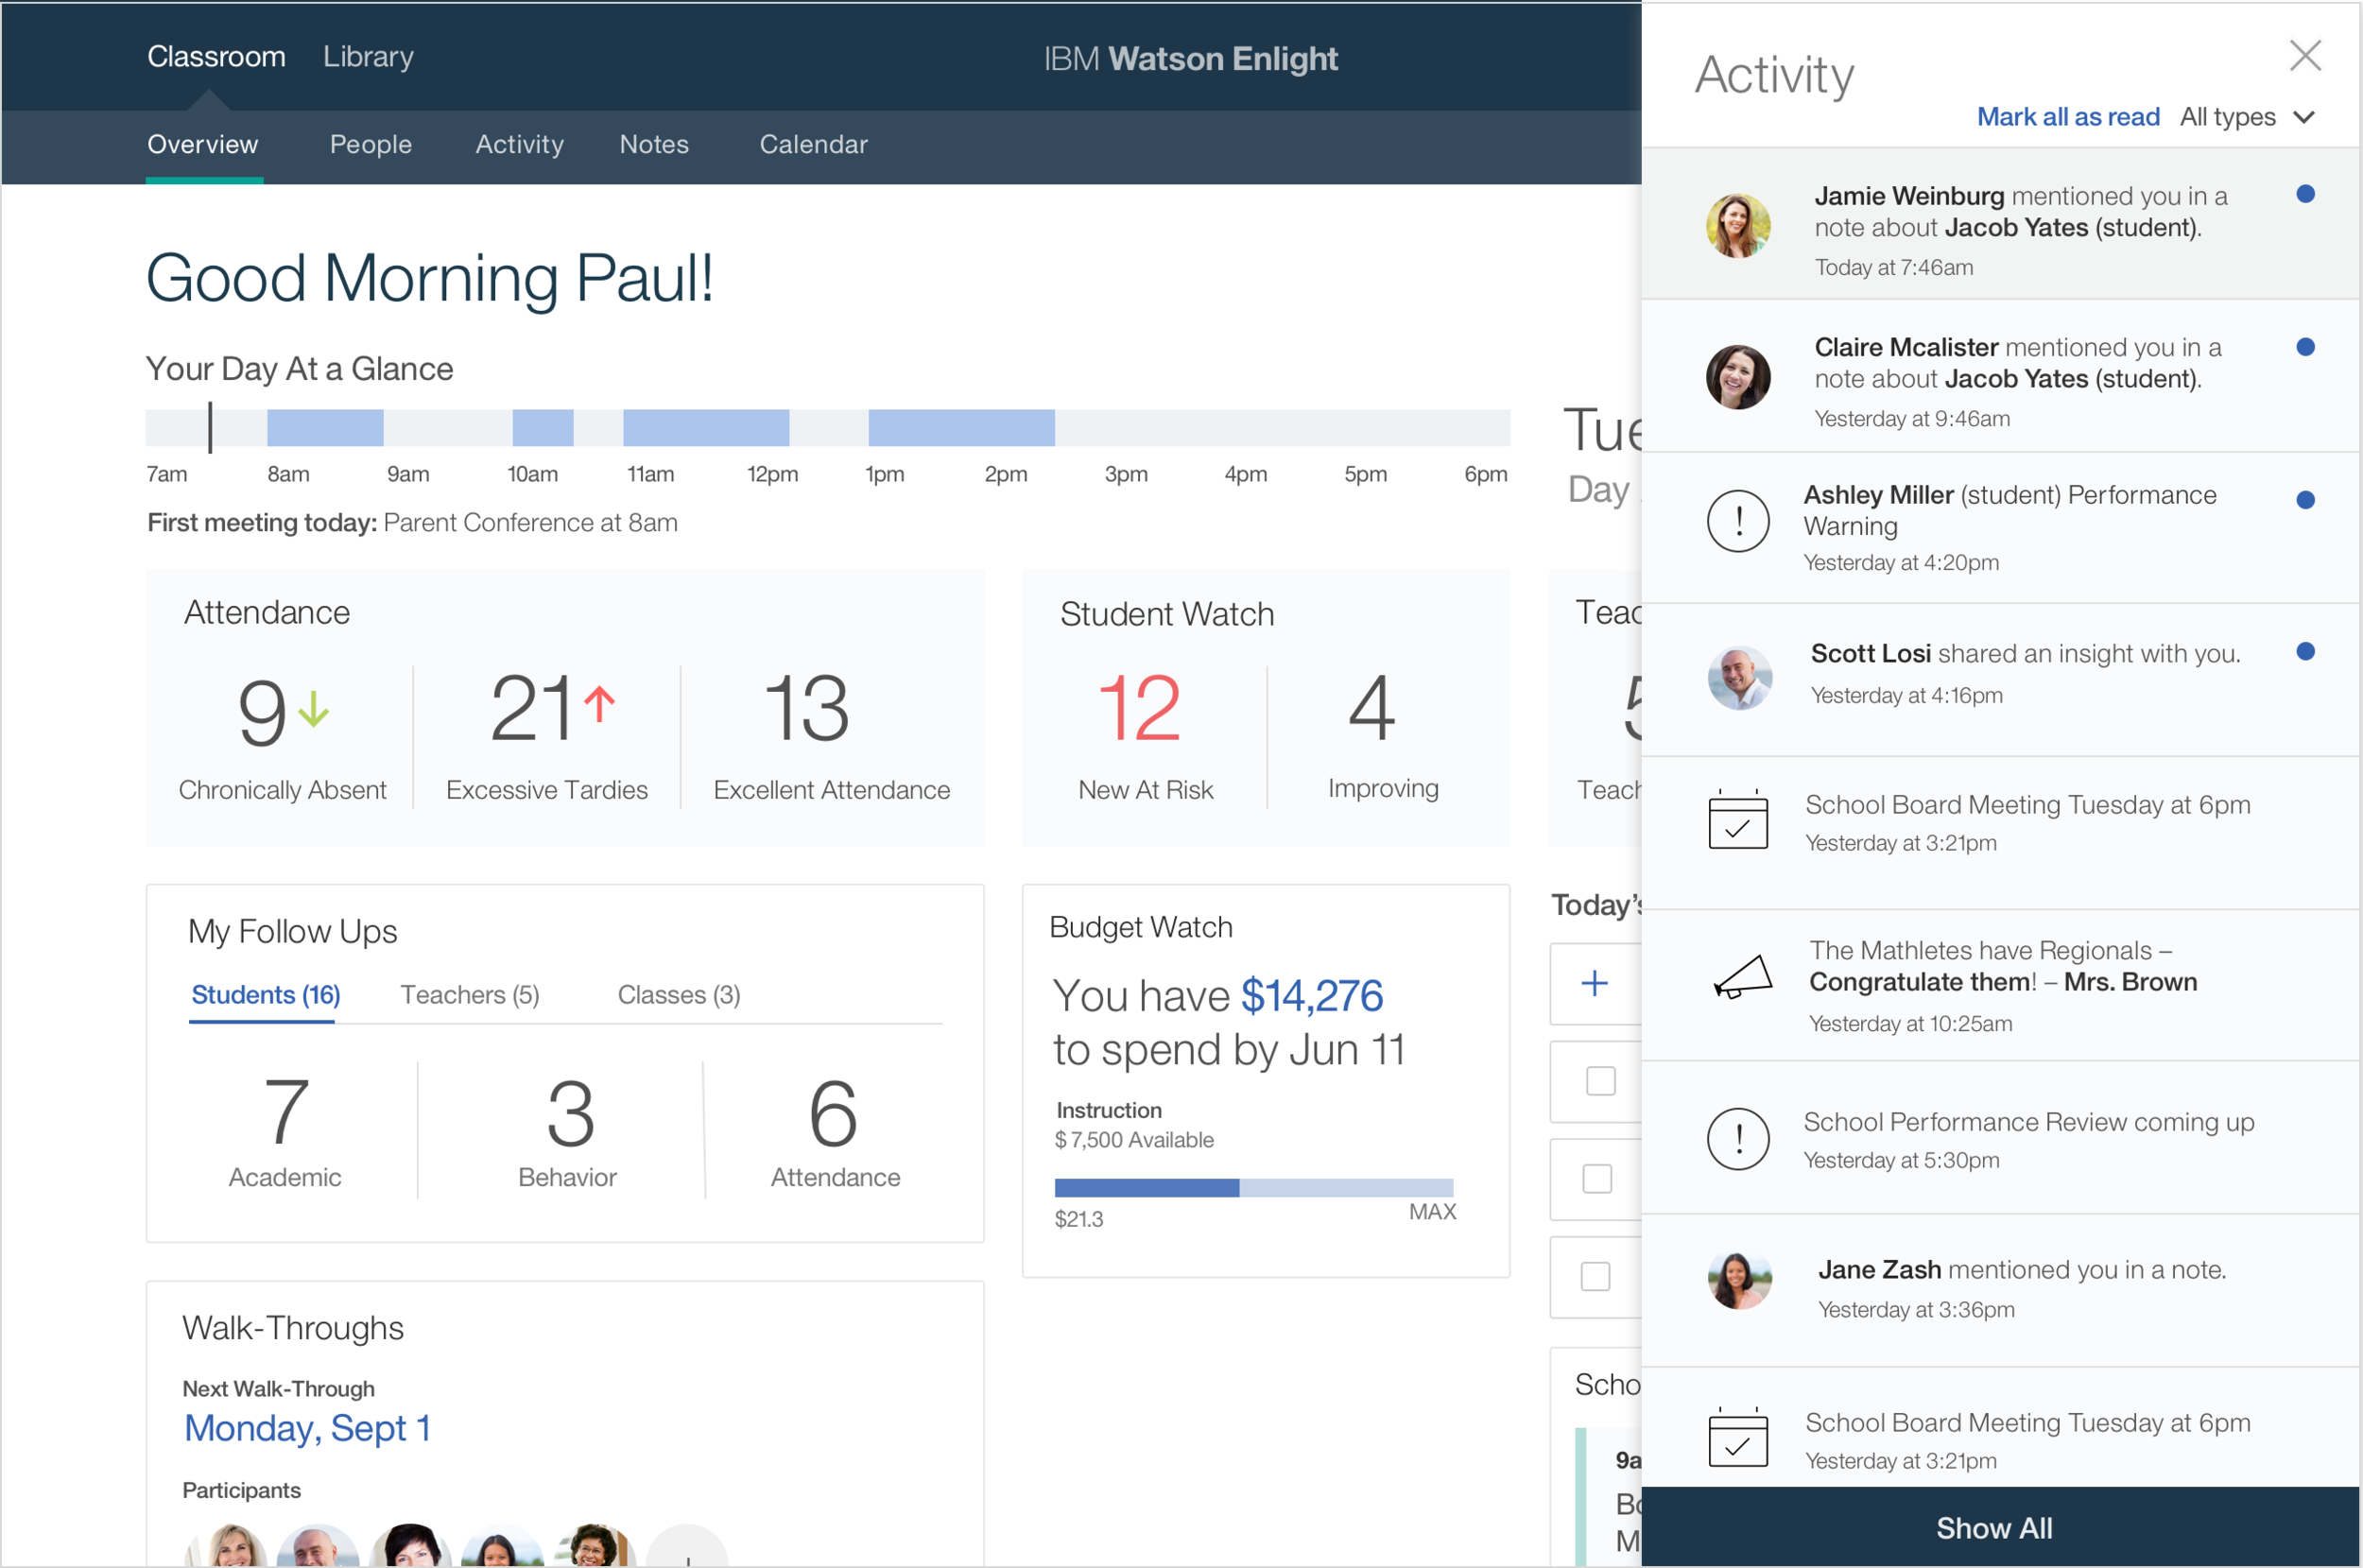
Administrators can quickly see notifications about new notes, proactive student warnings, learning insights, and events.
A holistic view of students
Student overview
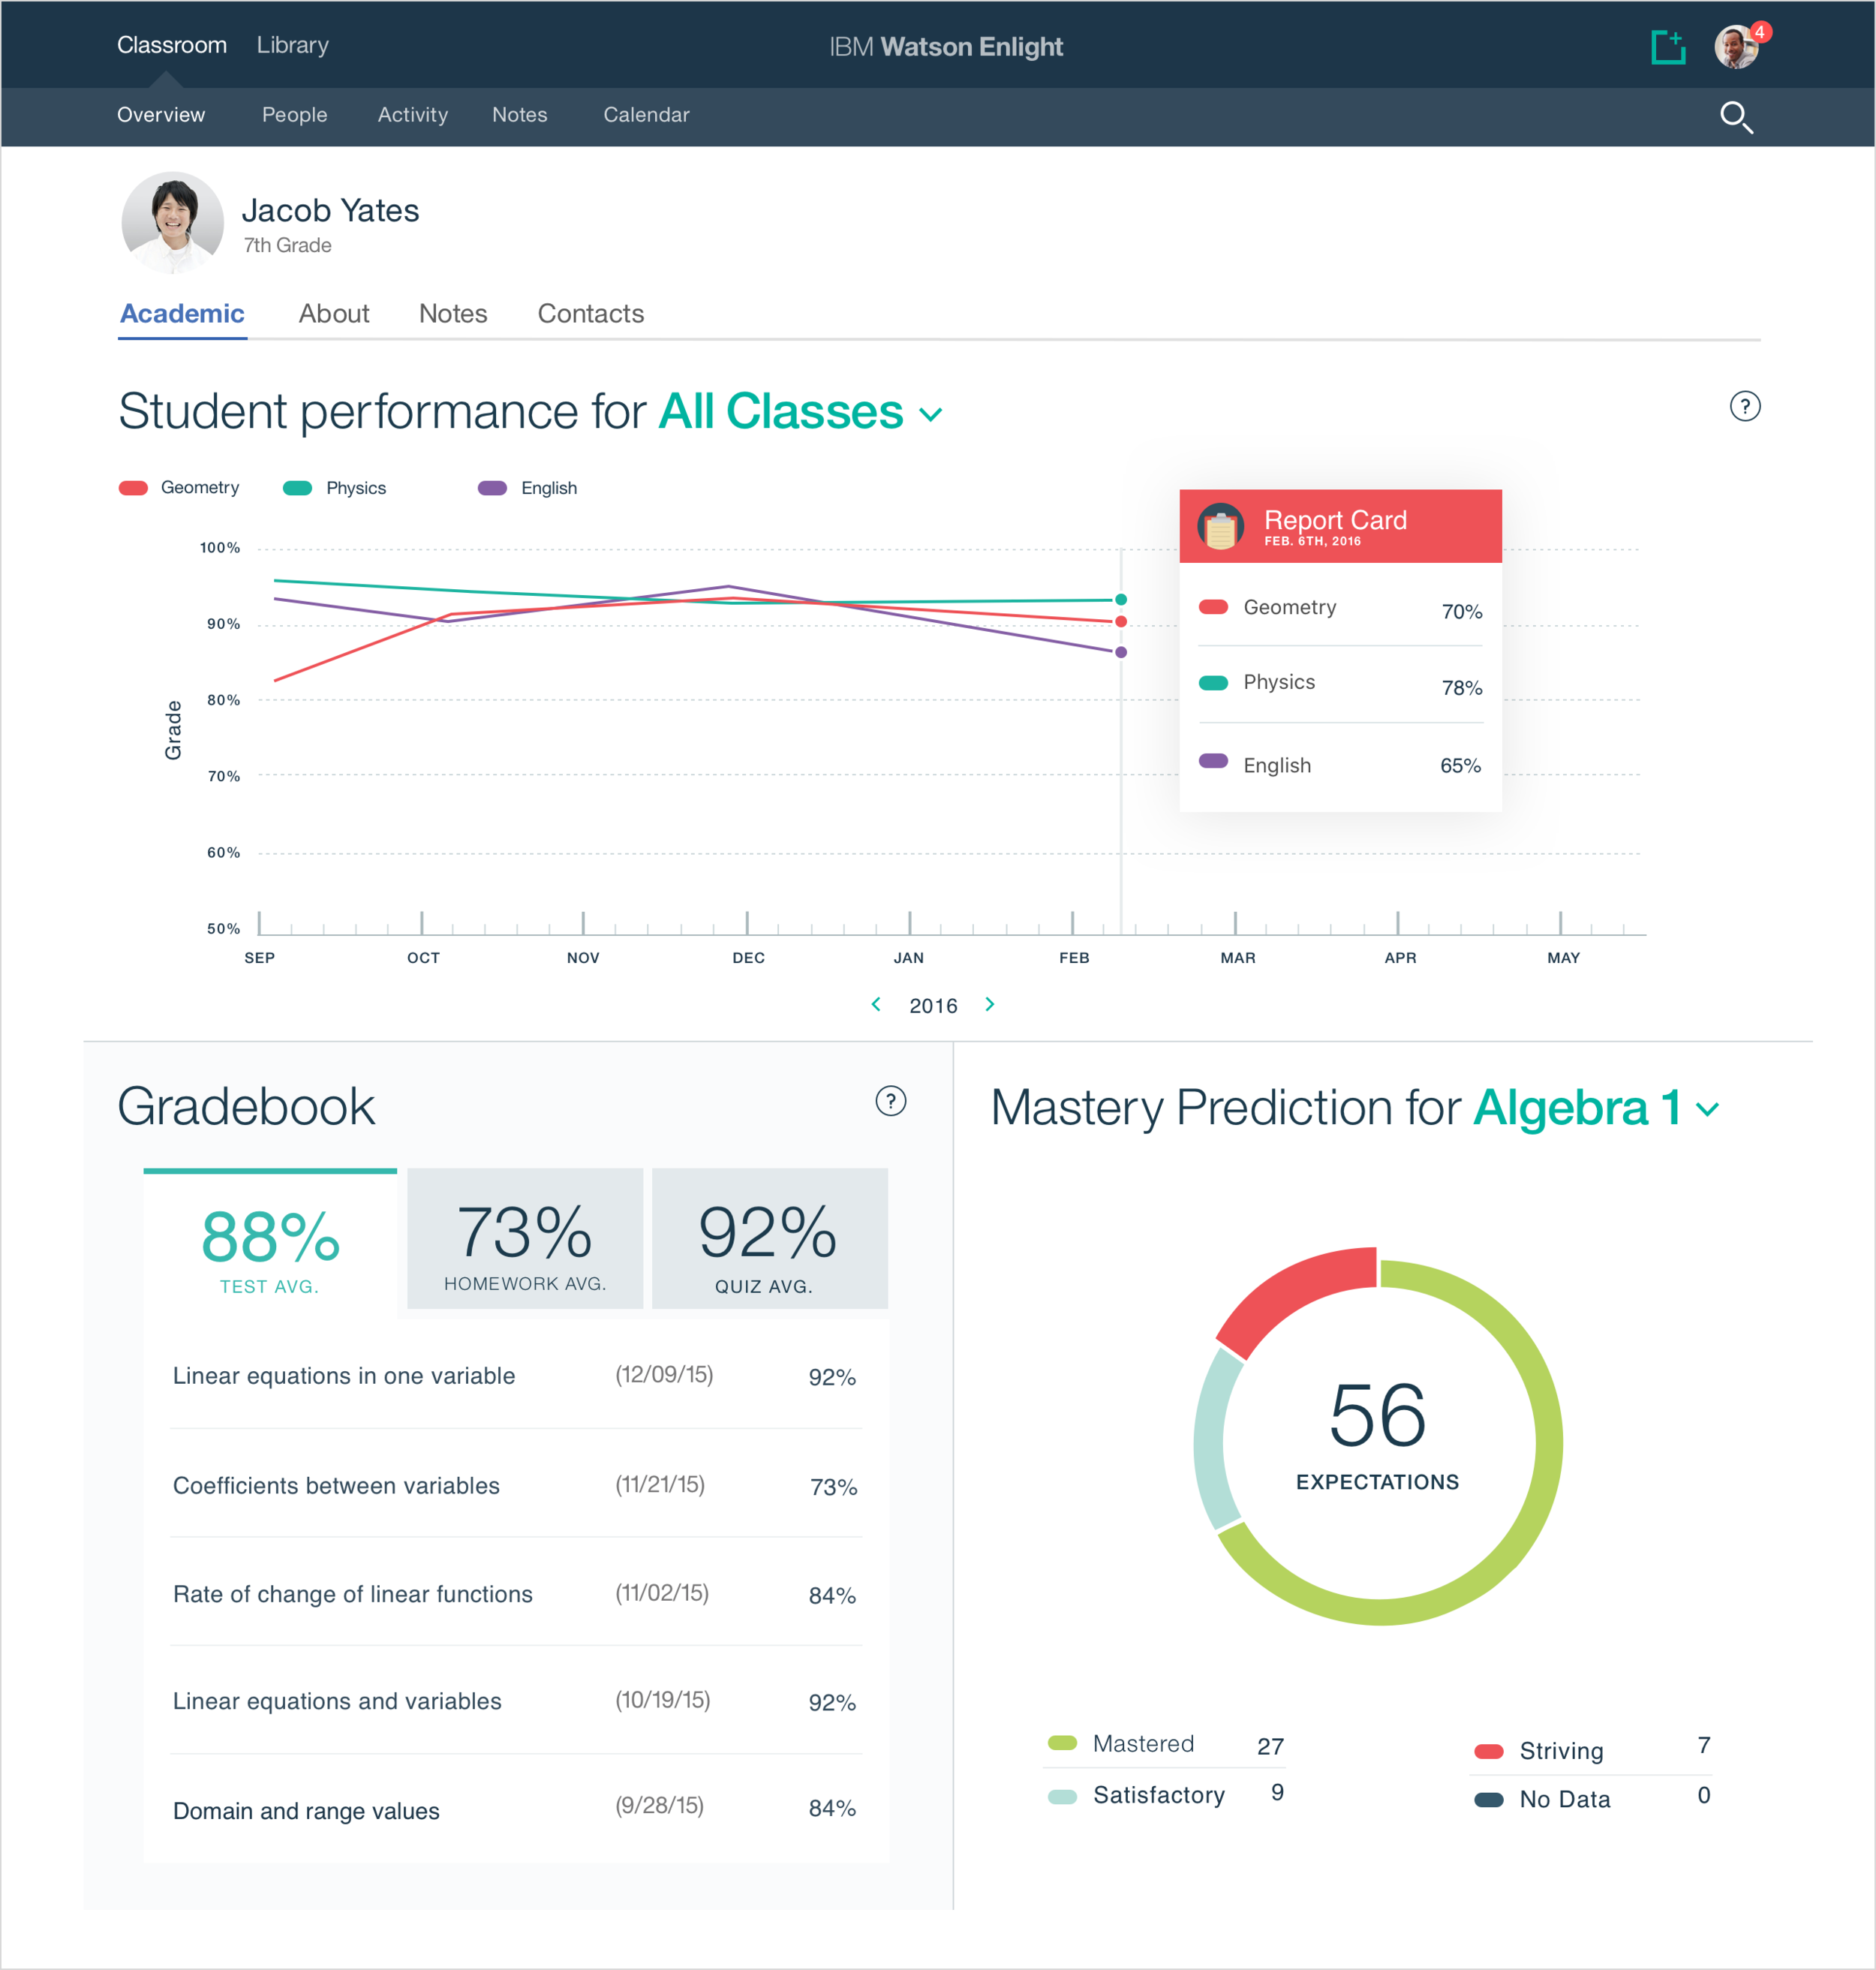
Teachers and administrators can access academic, attendance, profile information, and communicate and collaborate on creating personalized learning and intervention and 504 plans down to the individual student level and in context.
Keeping people connected
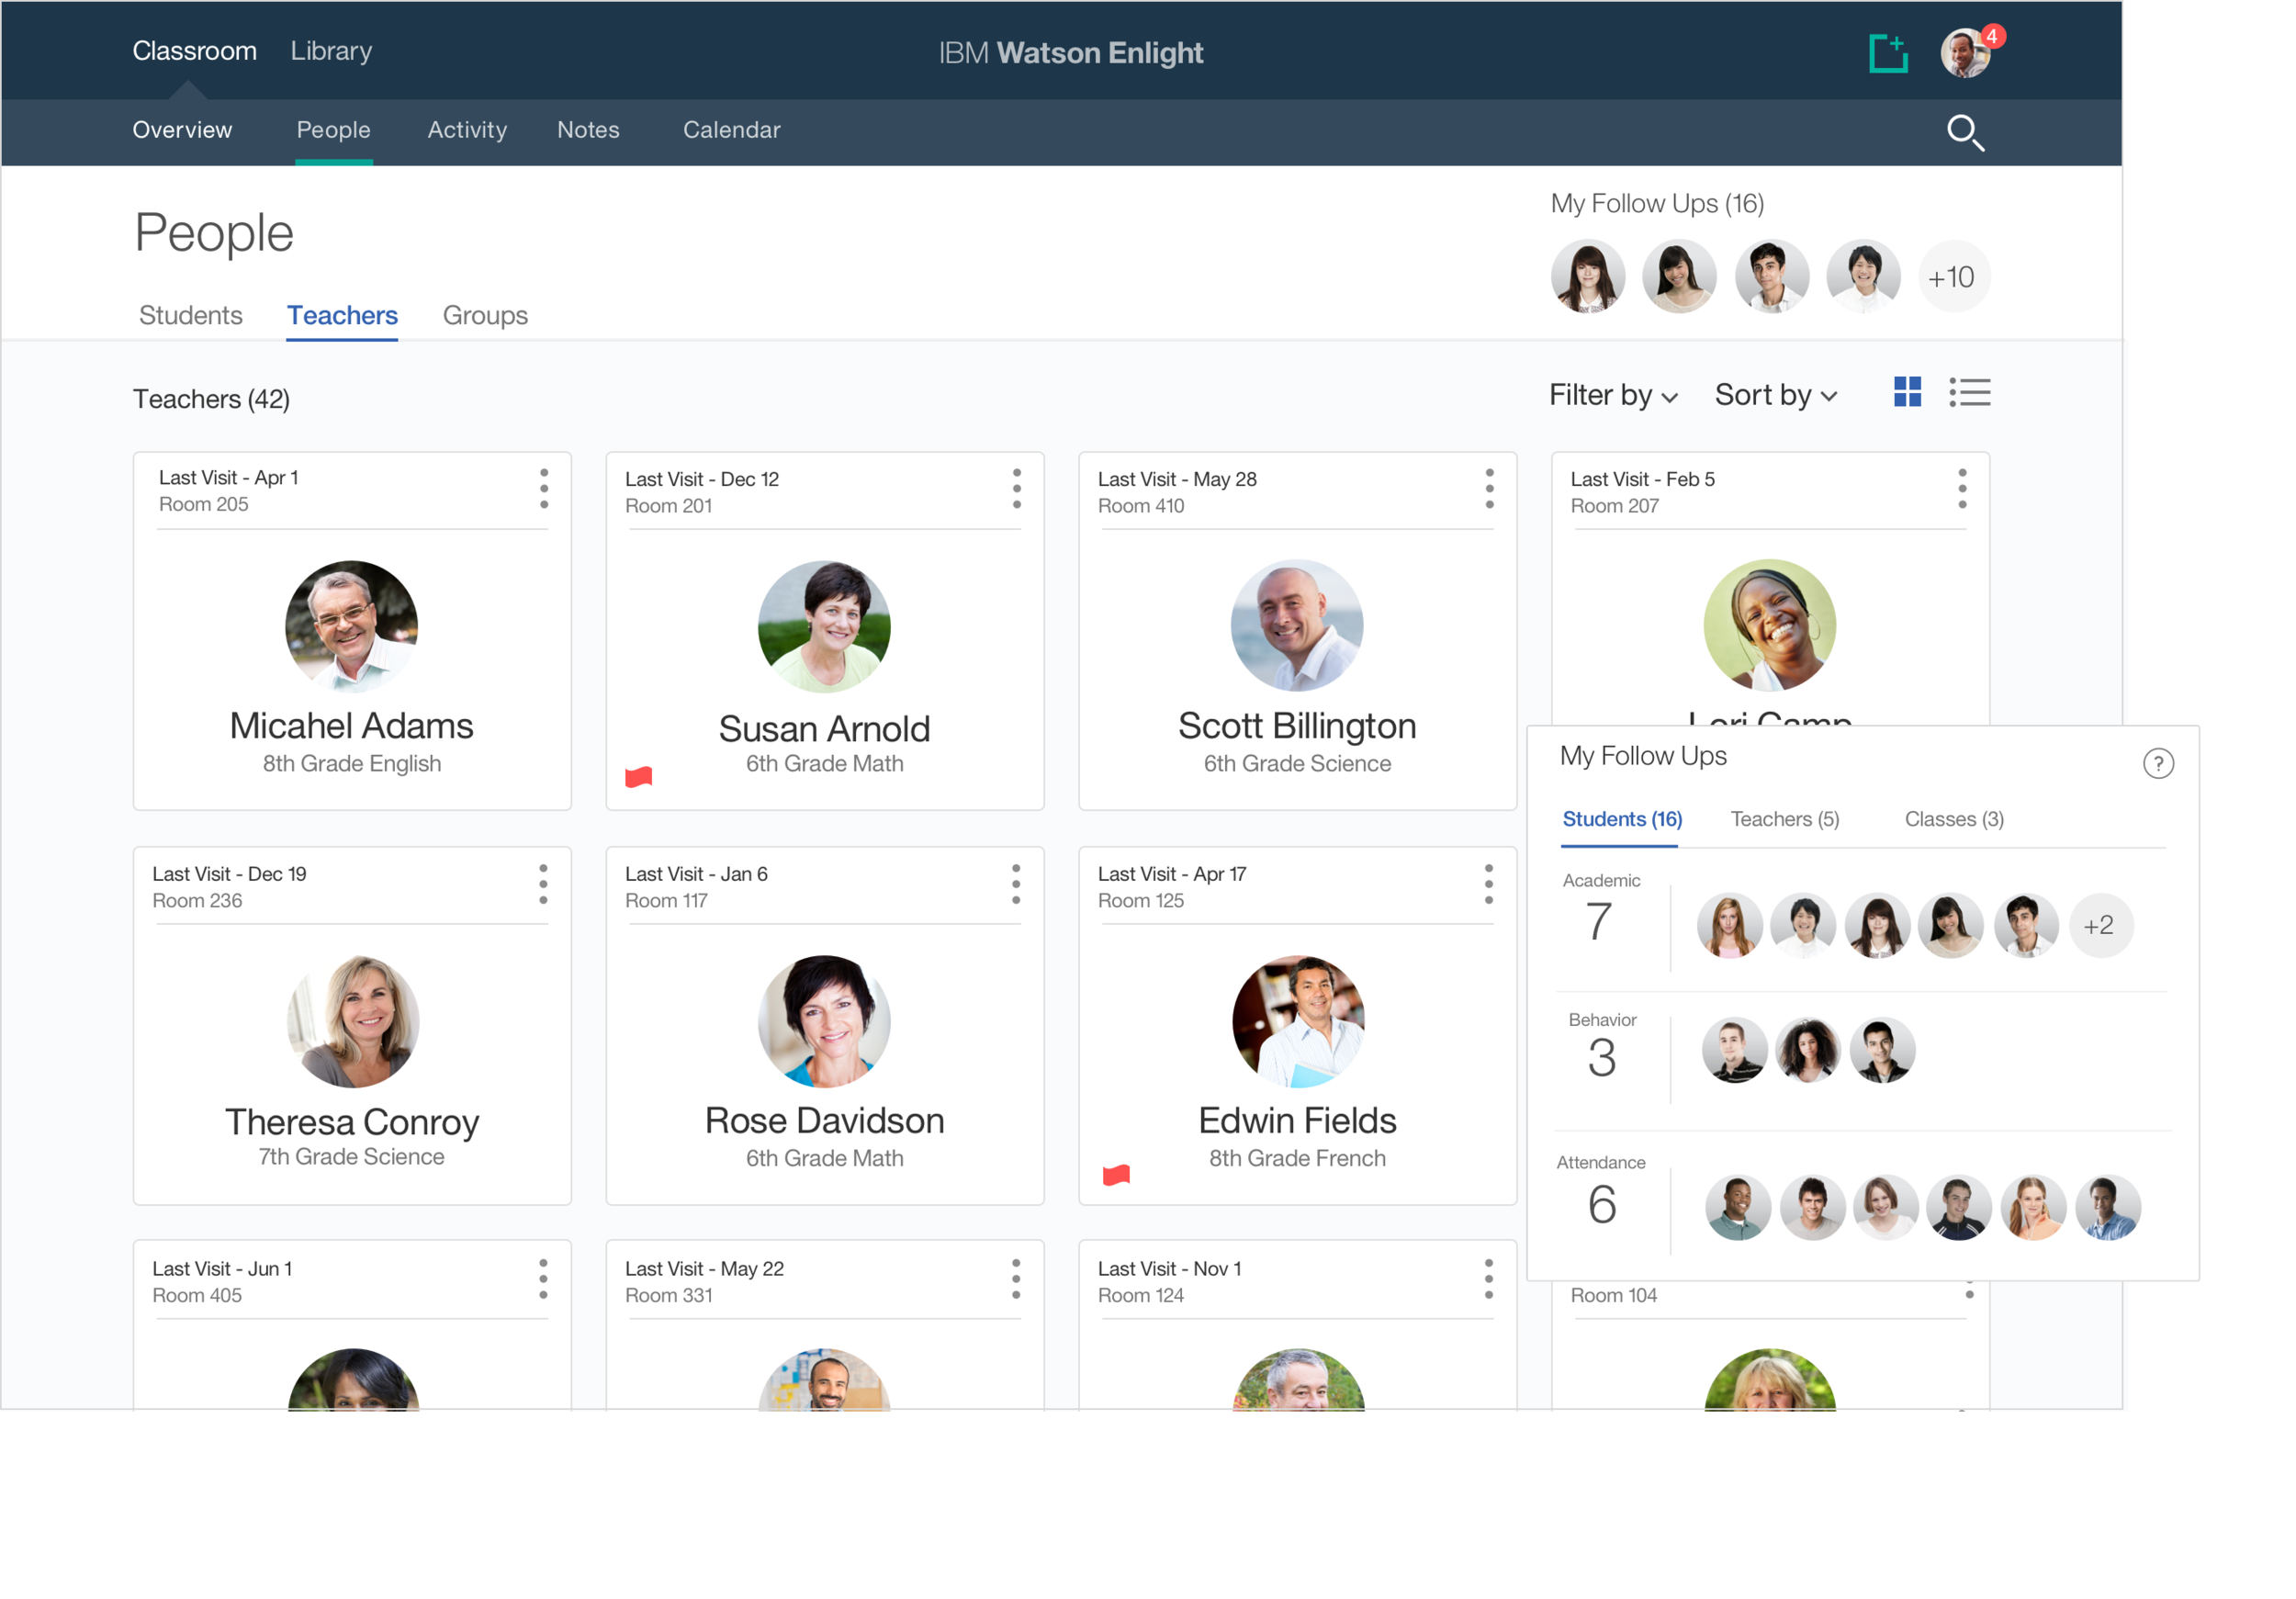
Every person at your fingertips
Administrators have a searchable directory of students and faculty in one place.
Actionable
From here, Administrators can access everyone's profiles, add notes, flag for follow-up, and send emails. Follow-ups are prioritized to ensure Administrators keep up with teachers and students, so nothing falls between the cracks.
Sharing the workload
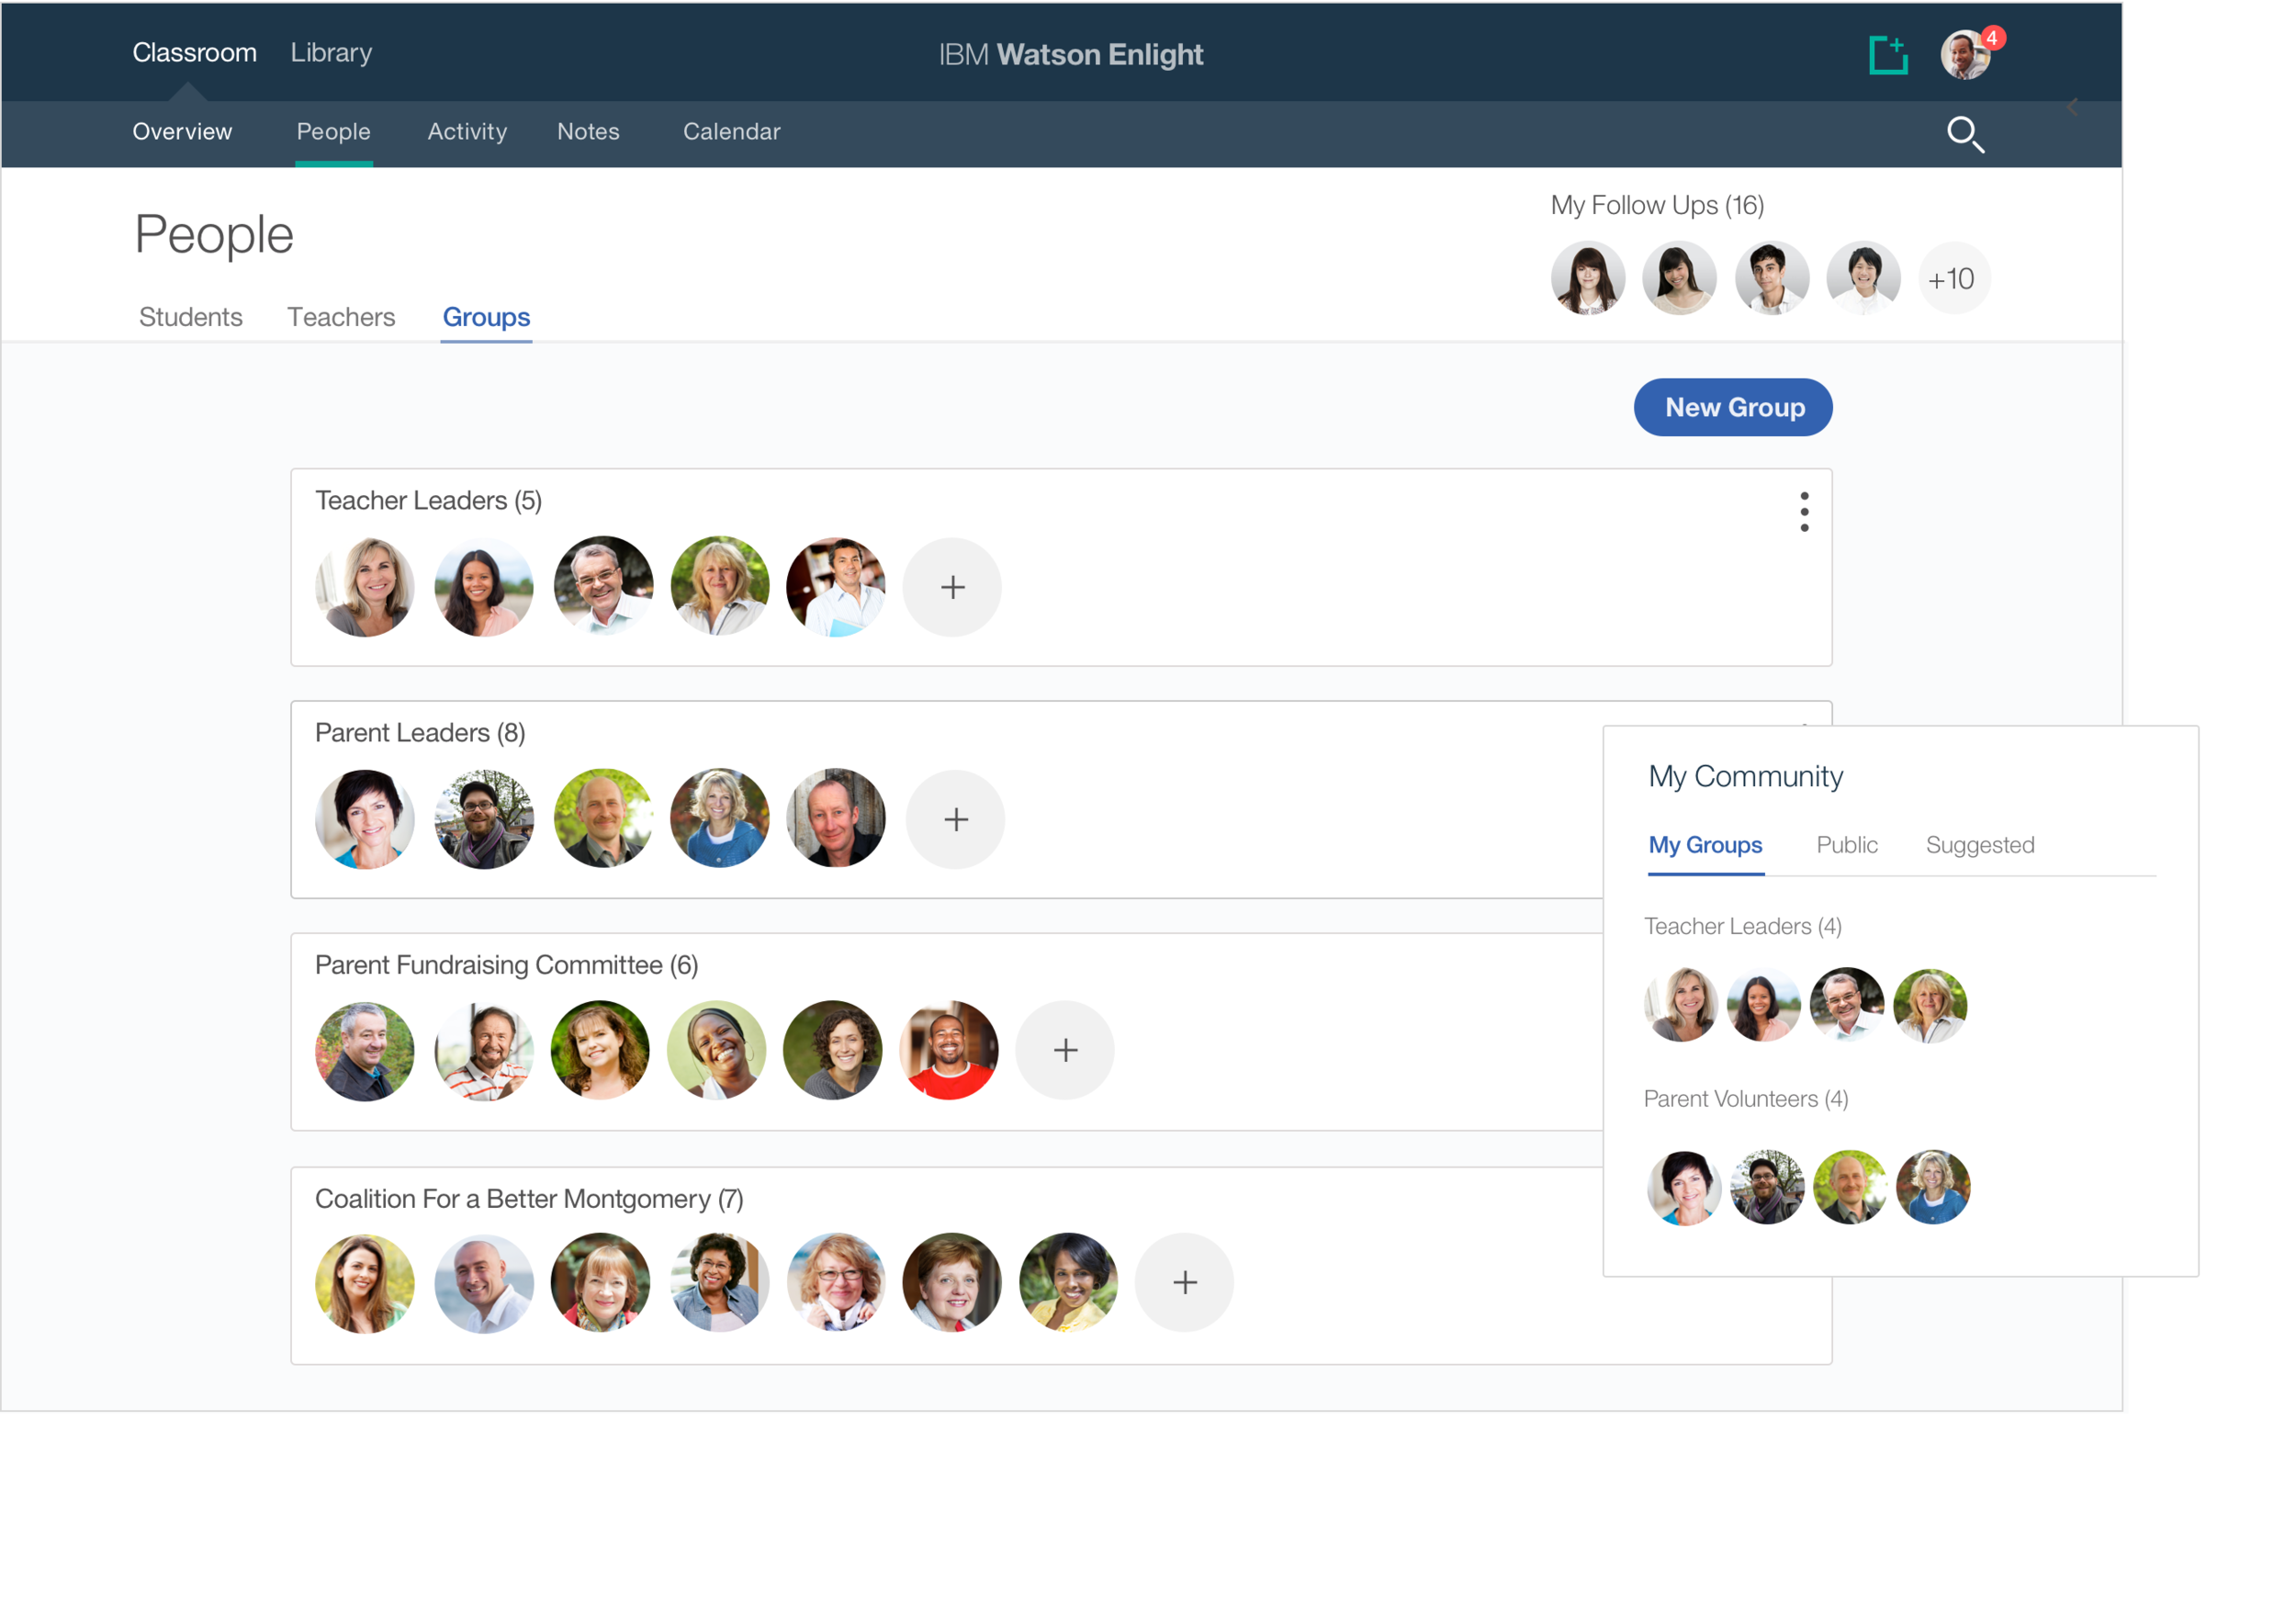
People page
Administrators can create custom groups of students and faculty and manage them in one location.
Communication and collaboration
Groups support communication amongst faculty and parents. The groups serve as a quick way for Administrators to notify essential information and delegate tasks, significantly reducing their workload.
Group examples
• Mentor Networks
• Peer coaching suggestions
• User generated and system generated
• Interest and need based communities
Keeping everyone in the loop
Notes
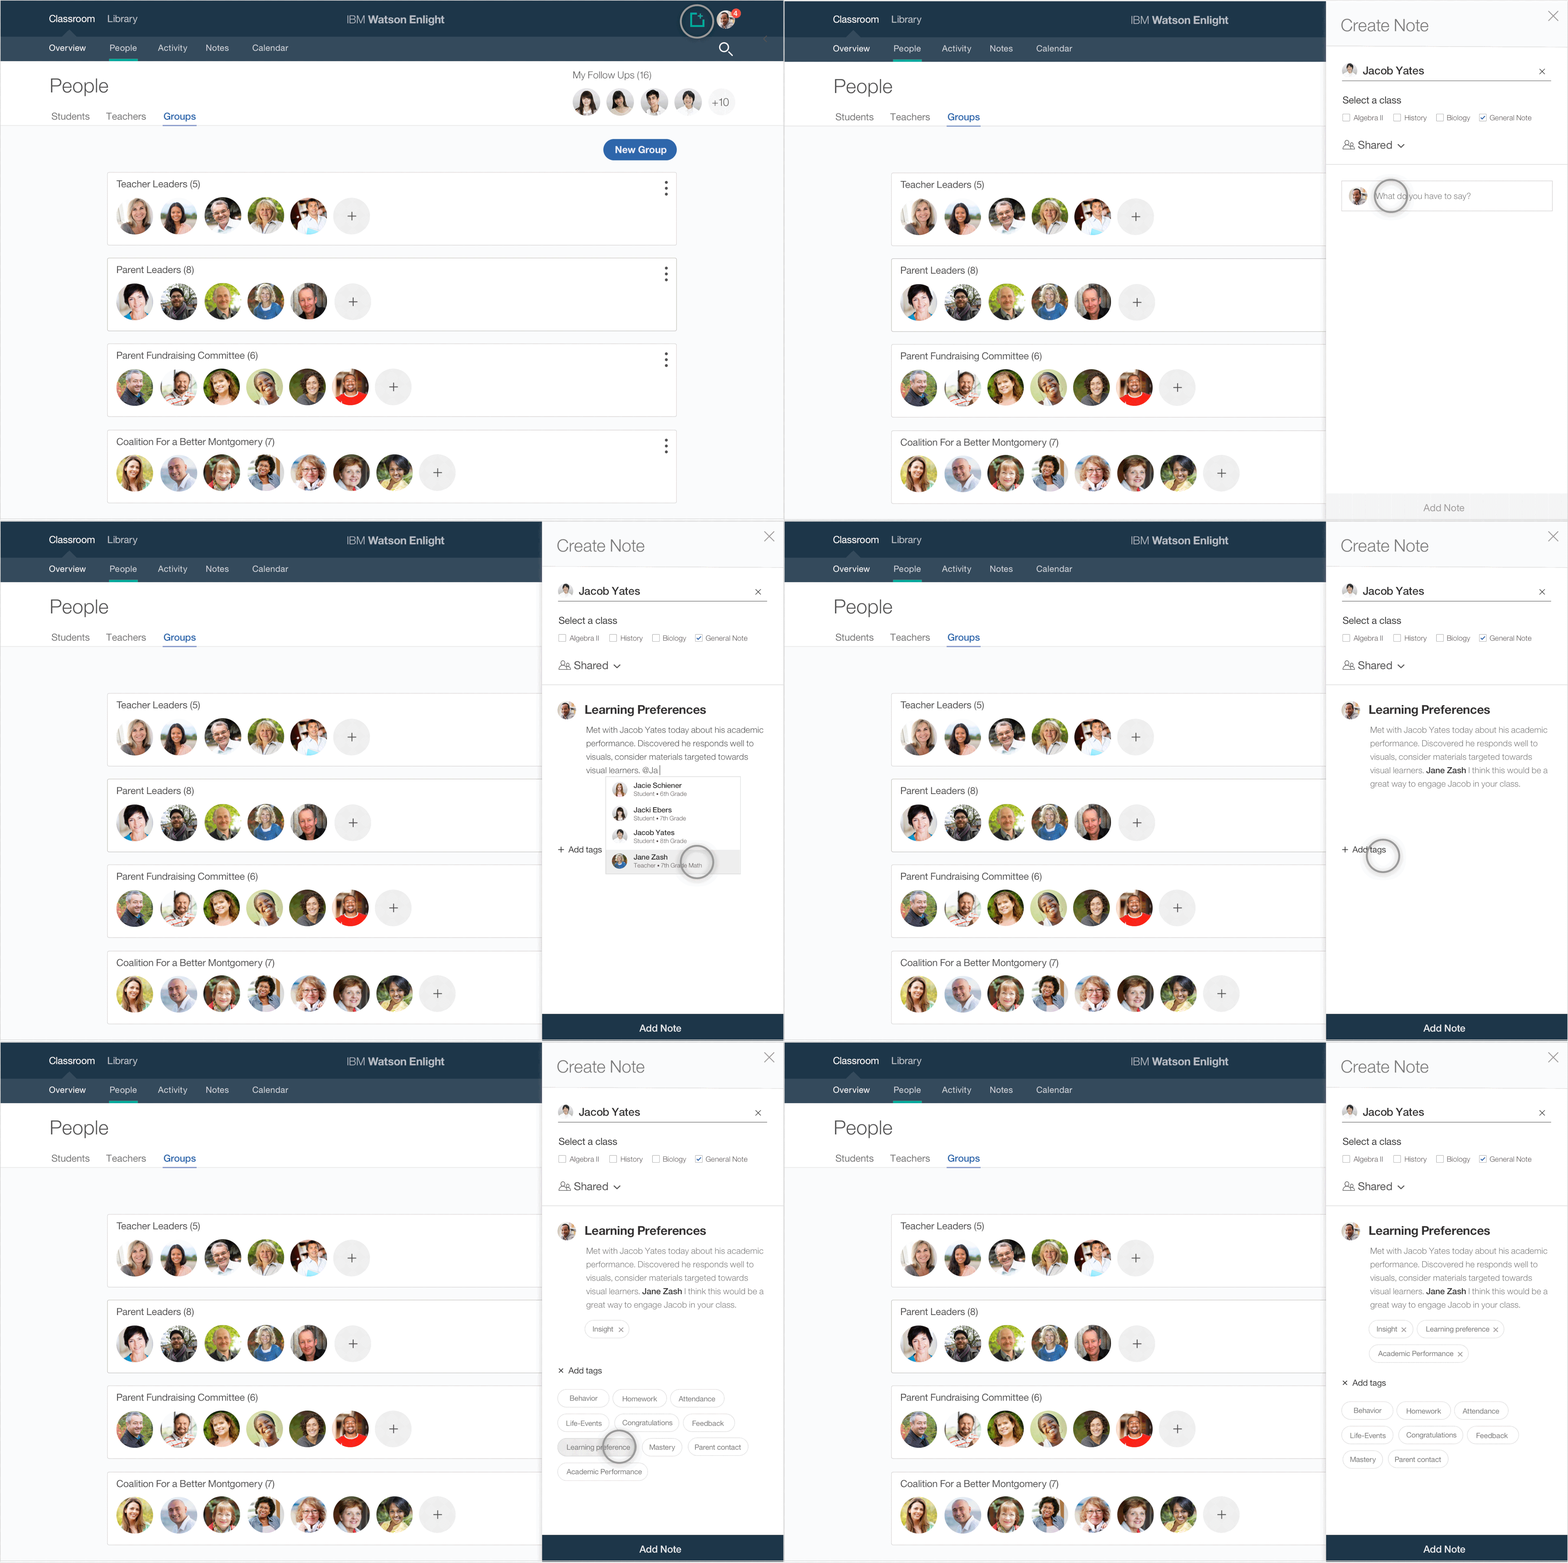
Administrators and faculty can create private and shared notes about both teachers and students.
Giving context and sharing insights
Administrators and faculty can quickly categorize notes to give quick context
of the note.
Progressive information collection
Users receive more tasks as they move through the create note process to reduce cognitive load.
Context
Tagging provides more context of the note and also serves as a form of filtering on the view all notes page.
Shareable insights
Users can @mention other faculty to share insights and create a plan of action. This opens up lines of communication between faculty and administrators to create a bigger picture of students. Once users are done with their note it is shared with students and teachers mentioned on their profiles.
Measuring success
| Business Goal | Metrics | Success Criteria | Rational | Output |
|---|---|---|---|---|
| Reduce number disparate of tools | Number of tools that are retired | 6 | Reduce operational costs for clients | All in one comprehensive platform |
| Maximize federal and state funding dollars | Federal dollars received per day | 5% increase | Maximize budget | Visibility into their budget by increased attendance percentage |
| Identify total attendance | Attendance per day as a percentage of whole | 5% increase | Tied to federal and state funding | Visibility into total attendance |
| Identify at risk students | Number of students who are not attending class, disciplinary actions and low grades | 5% decrease as it relates to total number of students | Analyze attendance to pinpoint students that need additional guidance and support | List of students available to educators and administrators who are at risk along with their risk profiles |

Conclusion
What I learned
Through interviews, shadowing, workshops, and user testing, I learned that Educators have a lot on their plates. Administrators need fewer tools, insight into the big picture of their schools, and a granular level of understanding of their students and faculty. It was vital that we had access to our users and we involved them in every step of the process. We created the product alongside our users, from the original conception to implementation.
What I would do next
Next, I would explore predictive modeling around forecasting potential at-risk students. The list of these likely at-risk students would propagate to educators on a real-time basis. Having this type of information would allow educators to focus on mitigating their potential financial risks.